
Thursday, December 16, 2010
A look at the daily chart
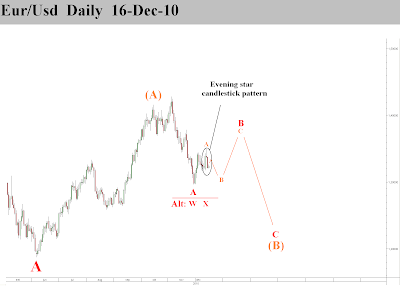
Here's a look at where we could be in the bigger EW pattern. Since the "big report" post ( dec 4th ) A of B finished a little higher than expected. From this high price has declined in what looks more like corrective price action to me. This confirms my view that we are in a wave B. To find out where this wave B ends i will analyze smaller timeframes over the coming days. The candlestick pattern, an evening star, is a topping pattern which is here to confirm the top of wave A. This also means price will probably go a little lower before ending wave B. The alternative would put price in wave Y where the corrective wave down from the wave A ( or X ) top is the early part of Y.
Subscribe to:
Post Comments (Atom)
No comments:
Post a Comment