
Friday, September 24, 2010
Fibs Ahead
There are some fib resistance levels around the 1.3500 level which could fall together with the end of wave Y. There are a lot of other possibilities at this point, but i'm sticking with this untill proven wrong.

Monday, September 20, 2010
Higher but below the top
Price action from the top looks more impulsive than corrective. The correction from the temporary low doesn't seem finished, so look for price to go a bit higher again before starting the decline again.


Sunday, September 19, 2010
The Bigger Picture
Here's a look at the bigger count. Both possibilities are pointing to lower prices as long as 1.3334 isn't broken.


Thursday, September 16, 2010
Still waiting...
Not much has changed since 2 days ago. Still waiting for wave 2 to end. Wave 5 of C is extended. The EW pattern seems very near completion, but there are some nice fib targets around 1.3170. It is possible that price gets sucked to those levels before reversing.


Tuesday, September 14, 2010
no ii but 2
Price went above the top of the first 3 wave correction, so wave 2 wasn't finished yet. That first 3 wave correction is now labelled as wave A of 2. Todays quick rally is common behaviour for a wave C. It is possible that price goes a little higher still, but it has to stay under 1.3334. After this price should finally, finally start wave 3.


Monday, September 13, 2010
Top of ii ?
Our patience has paid off as price went higher as expected. While it's not 100% sure that wave ii has reached it's top, chances of it doing so have greatly increased. The Fib's i mentioned in my previous post are respected and the channel, which is now acting as resistance, has been retested.


Friday, September 10, 2010
More patience required
Price went slightly below the support but failed to stay there. The strength tells us wave 2 isn't over yet, so look for wave ii to test 1.2818, which is where wave C = 1.618*A and where wave 1 is retraced by 61.8%.


Thursday, September 9, 2010
Wave iii of 3
Wave ii took more time but should be finished now, there's always the possibility that wave ii takes more time ofcourse. That is why my focus is on the wave i low support. If this can get broken, the decline in price should accelerate and wave iii will have started.


Wednesday, September 8, 2010
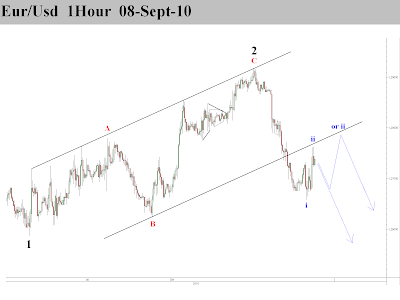
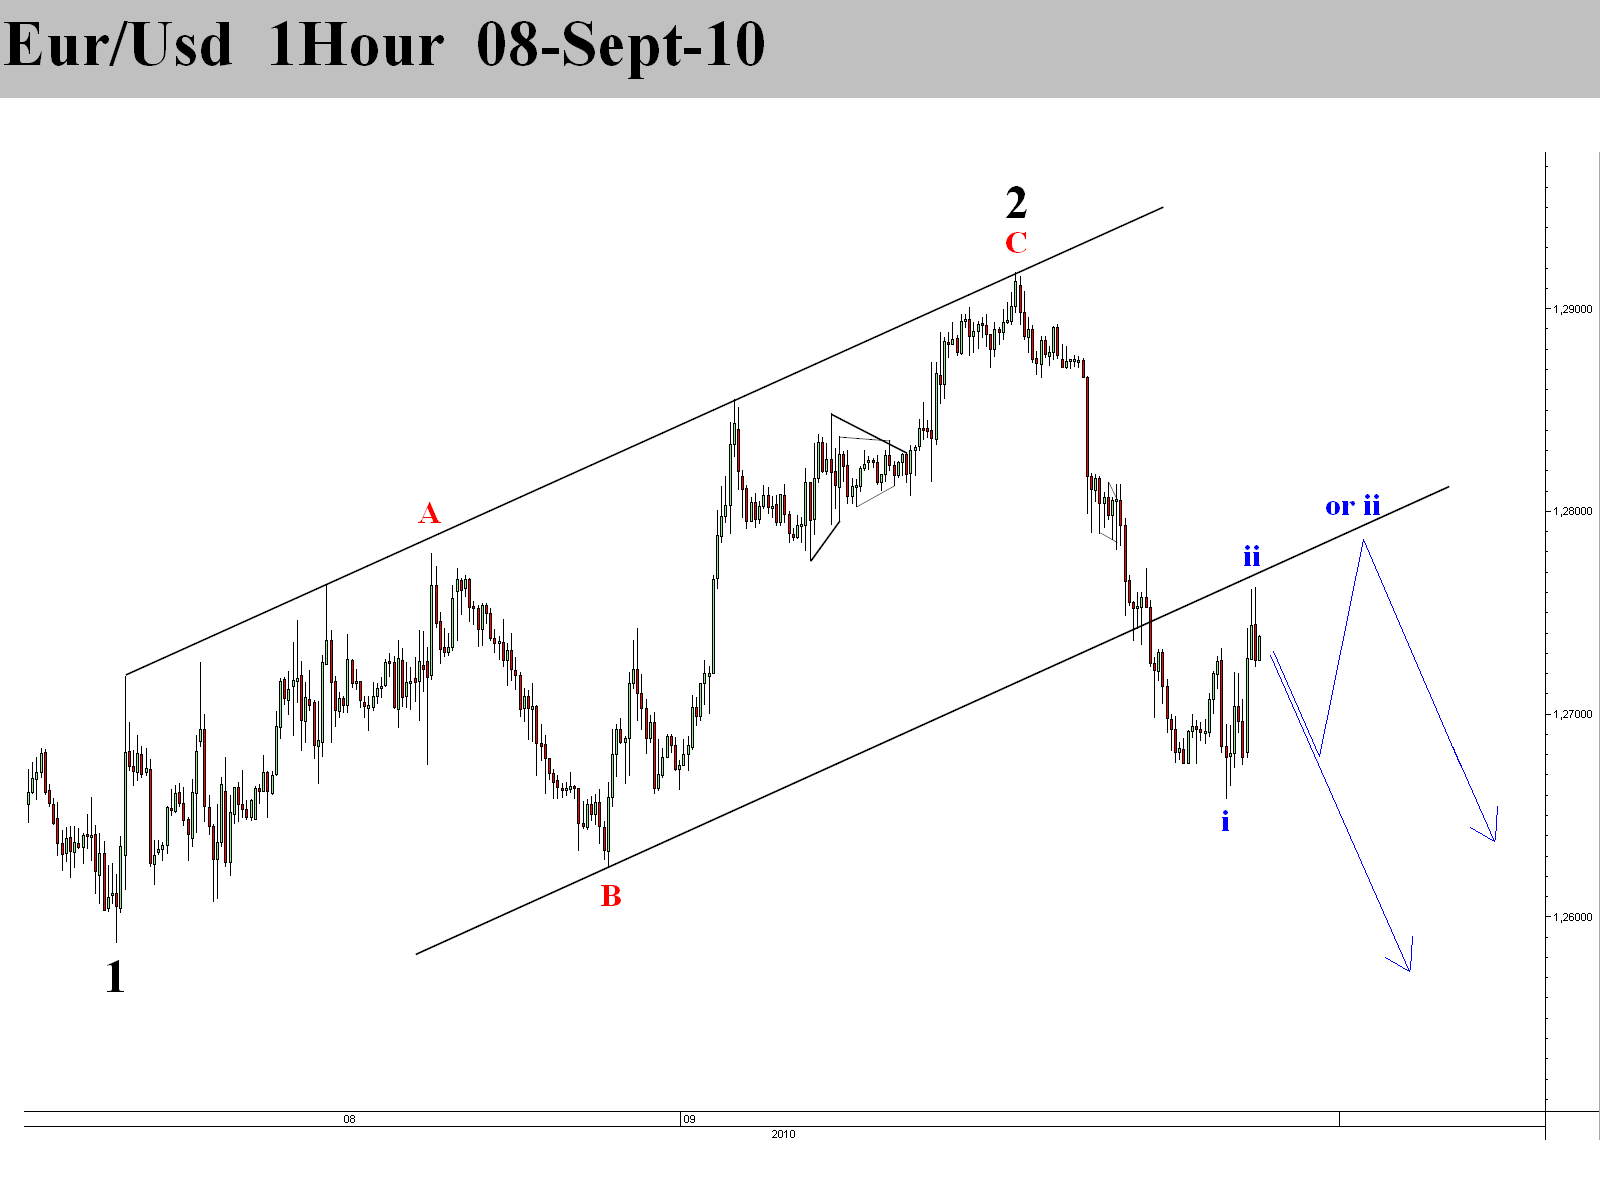
It's now or later
Wave 1 extended a bit lower but it's still only wave 1. It's expected behaviour when in a wave 3. Small corrections are also common, so keep in mind that this wave 2 could be finished at this point. It's no garantuee however, wave 2 could take more time and finish higher but price should stay below the trendline resistance.
Tuesday, September 7, 2010
The Fall Begins Today
The correction appears to be over at last! With these 5 waves down, look for a 3 wave correction up for a nice shorting opportunity.


Monday, September 6, 2010
A bigger correction
Here is the alternate count in case price action after the triangle is part of a bigger correction. A target would be around 1.3075, here wave W would equal wave Y, it's close to the 61.8% FIB and it would restest the trendline.


She's so pretty from a distance
On the 4Hour chart this count looks good and the correction seems finished. The problem is when you zoom into the smaller timeframes there are no 5 waves to be counted in wave 5 of C (see previous post, that count was invalidated). For this reason i'm being carefull calling a top, since the correction could go on to be complex. Below 1.2587 will give me more confidance that wave 3 has started.


Sunday, September 5, 2010
Rough waves
It appears, for now at least, that the triangle count was the correct count. Note that there's a triangle wave D in the triangle, which as far as i know is pretty rare.


Price following the triangle isn't really what i call perfect impulsive action. I looked for expanding and contracting diagonals with and without the wave 4 triangle, but none of them seem to fit if you respect the rules. Another thought is that this triangle is a pause in the bigger correction, meaning a wave B or X. This would fit price action after the triangle a lot better. There's only 1 thing to do now unfortunatly, that is wait for clarity again...

Friday, September 3, 2010
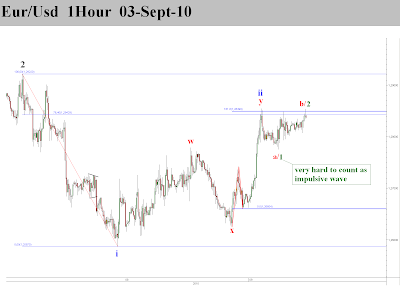
Happy NFP day!
With all the possibilities on the table here's one just of them. Price since the 1.2855 high can be viewed as a triangle wave 4, but i think it counts a little better as a wave a and b complete. I also put a possibility on this chart to count the decline from 1.2855 as impulsive. It is really hard to count it impulsively, you could even say it's forcing a count on it, but i'm keeping an eye on it anyway since a wave 3 of several degrees could start anytime. Especially with the NFP numbers coming out, price could be ready for a really big move.

Thursday, September 2, 2010
Tough decisions, clear direction
There are lots of possibilities at this point. A first choice comes when deciding how to count the initial decline, is it a 1-2-i combination ( left ) or is it a complete wave 1 ( right )? After that there's another choice for the correction. Is the correction over, nearly over or is only the first part of the correction over? We'll have to wait and let the waves show us the correct count. 1 thing is clear however, the 1-2-i combination and the complete wave 1 both point to eventual ( or immediate ) lower prices.

(click to enlarge)

(click to enlarge)
Wednesday, September 1, 2010
The storm is delayed
Wave ii wasn't finished yet but it is clear that we are in a corrective mode with a good chance of a wave iii of 3 starting anytime. Look for a news event to start the decline, maybe ADP or NFP? If price goes above the red line, there will not be a iii of 3 but rather just a wave 3.


Subscribe to:
Posts (Atom)