
Tuesday, November 30, 2010
1 of the 4 is bottoming
Here's a possibility for a bottom for EurUsd. It is the upper left choice of the 6 choice roster from the nov 26th post. 1.3354 was the high made during the first trading hours of this week (not visible on all platforms) and this would be the level of confirmation for the count proposed if broken to the upside. A new low would invalidate this count ( there is a possibility for these 5 waves down to be 1 of 5 but that would make wave c really big ) and put focus back on the remaining 3 possibilities.

Monday, November 29, 2010
4 Pack
As 2 of the possibilities have been invalidated due to price going to a new low, there are 4 possibilities left on the table. The upper left is the least bearish and the bottom right is the most bearish. Note that the chart is the same from nov 26th without updated price. Since then there was a little corrective bounce ( a little bit bigger if you consider sundays early price action ) to complete the wave b, 2 or ii.


Friday, November 26, 2010
A 6 Pack Of Choice
It appears the short term count was correct and we did get another leg down. So it's time to get back to the larger timeframes, where there are a lot of possibilities. It depends on how you count price around the top, is the top a normal wave 5 ( of C ) top or is the top followed by an unorthodox 2nd top in the form of an expanded wave b? My personal preference is for the wave b top, but i keep a close eye on the triangle count.


Thursday, November 25, 2010
Triangle
Wave 4 did transform into a more complex correction, a triangle. 1.3420 is the limit for the triangle count. Should price go above that level, wave 4 will be counted as a double three complex correction.


Wednesday, November 24, 2010
One more wave down
With all the possibilities on the bigger timeframes, it's time to zoom in a bit. Here, things seem a bit more clear. 15min chart shows a nice impulsive wave down where we need one more wave, wave 5. Wave 4 could be finished or could transform into a more complex corrective wave.


Tuesday, November 23, 2010
3 Possibilities
Unless this decline was an expanded wave b of B flat ( first alt count ) this count now looks like the most possible count. Another alternative brings back the triangle wave 4 count, where the top is not an expanded wave but a regular top. This alternative count would put price in a wave C with lower prices to come ( price 1.3785 - 1.3660 is in 1-2-i ). In the other 2 counts price needs to rebound higher ( price 1.3785 - 1.3660 would be counted as a-b-c ).


Monday, November 22, 2010
Pause in the wave B rally
Price has gone up in a corrective way since making the low at 1.3447 and this correction now looks complete. In the bigger picture this would be wave A of B. Price after the 1.3785 high looks very much impulsive, but this doesn't mean we're not in B of B, it could be the first part of a zigzag (5-3-5).


Thursday, November 18, 2010
The new wave B
With price going above 1.3572 i am now going to this count where the bottom is in. This would put price in wave B, where wave A was the expanded flat.


Wednesday, November 17, 2010
The real end of wave C?
Wave C appears to have more downside to it. Price seems to be in the last parts of that decline. The proposed count could take us to around 1.3350. 1.3572 is the line in the sand for the main count, above that the chances that the bottom are in increase a lot.


Sunday, November 14, 2010
Start of wave B
Price has broken through a trendline suggesting higher prices after rallying from the wave C low. The expanded flat was probably wave A, so this would put price in wave B. Expect price to rally higher this week but chances are low that price will make a new high.


Friday, November 12, 2010
Expanded Flat Done?
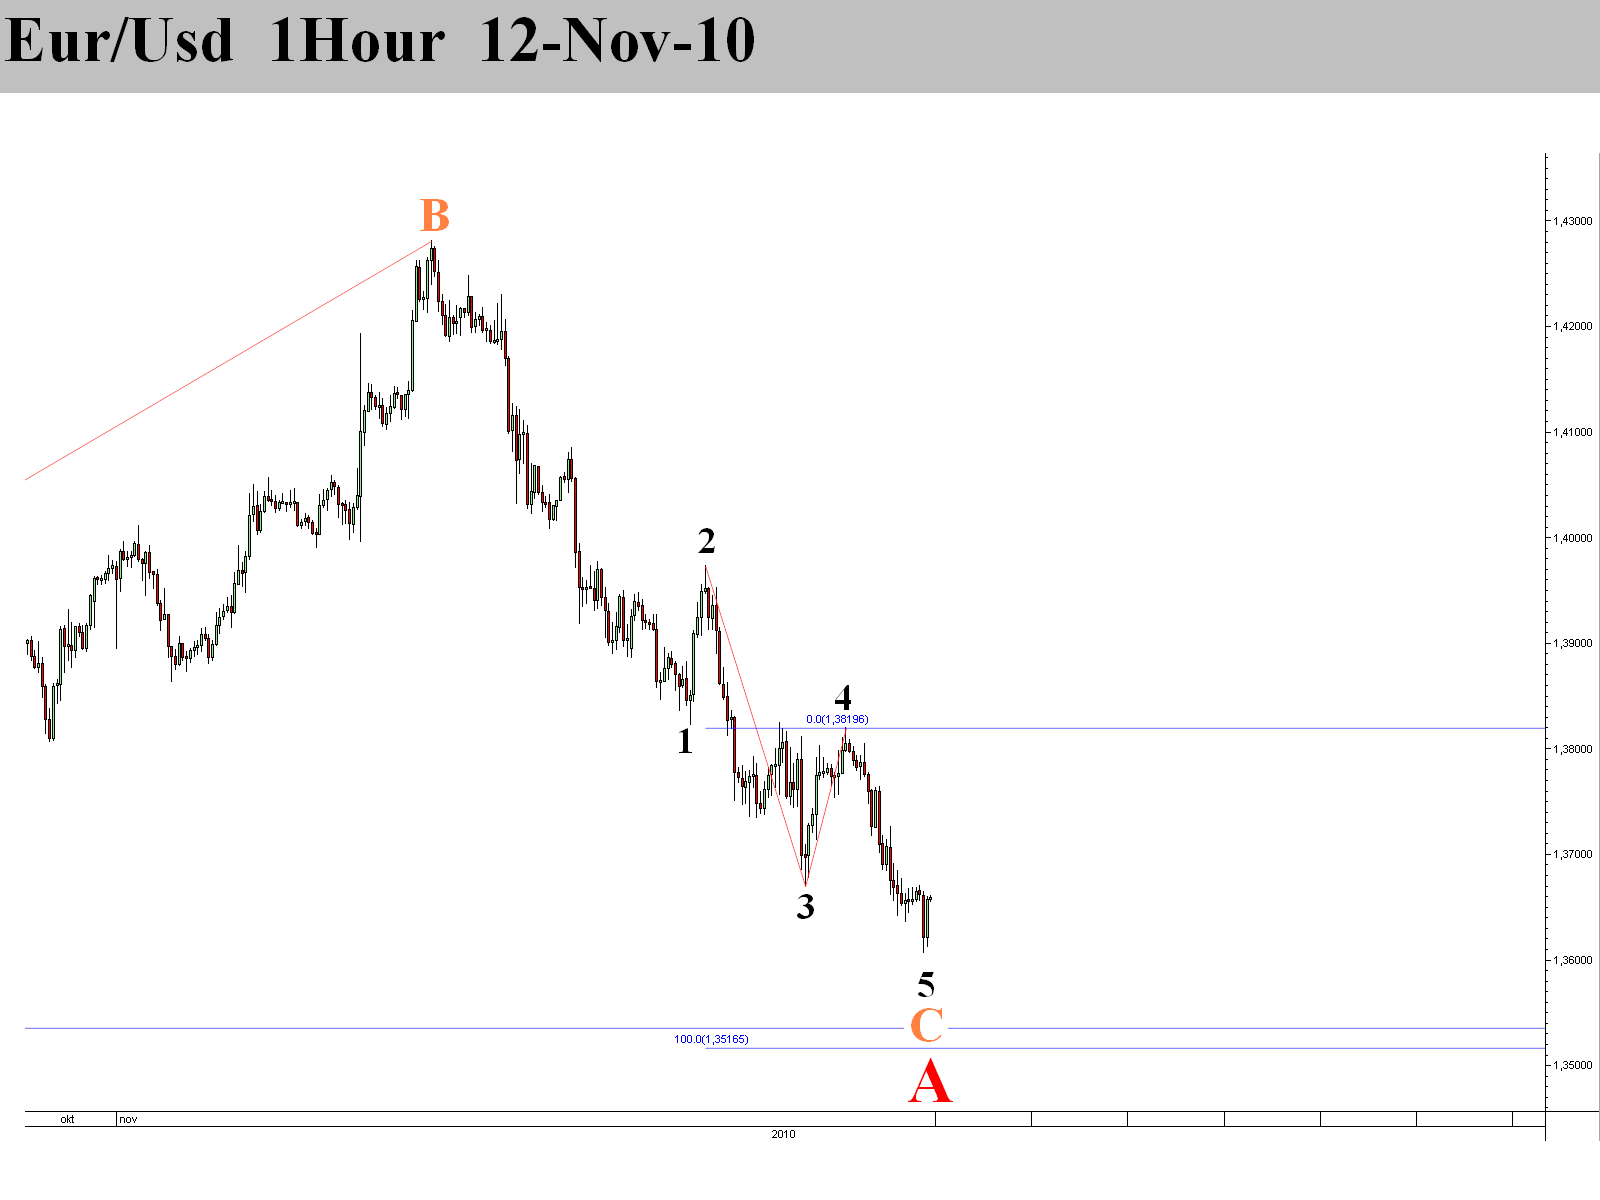
Price has followed the expected path nicely, but did so faster than expected. Price also did not reach the 161.8% FIB extention of wave A, but it did come below the wave A low, so it is a valid end point for wave C. If price goes below 1.3516 i will need to adjust the count to a more bearish one. But for now this decline looks pretty much finished.

Wednesday, November 10, 2010
Little room to play
The wave 2 was short and sharp like the count was suggesting. Wave 1 could have been extended since a nice price target would be 1.3535. That leaves little room for a wave 3, 4 and 5 to form. Other possibilities are that price will go much lower than 1.3535 in a big wave 3 or another possibility is that the top was not wave B but rather wave 5 of a previous wave pattern and wave 1 was wave A followed by a short and sharp wave B. Like always time will tell, but i'm sticking to my count untill proven otherwise while keeping an eye at the other possibilities.


Tuesday, November 9, 2010
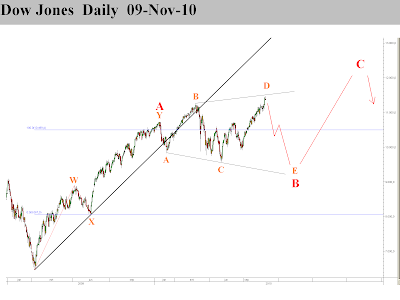
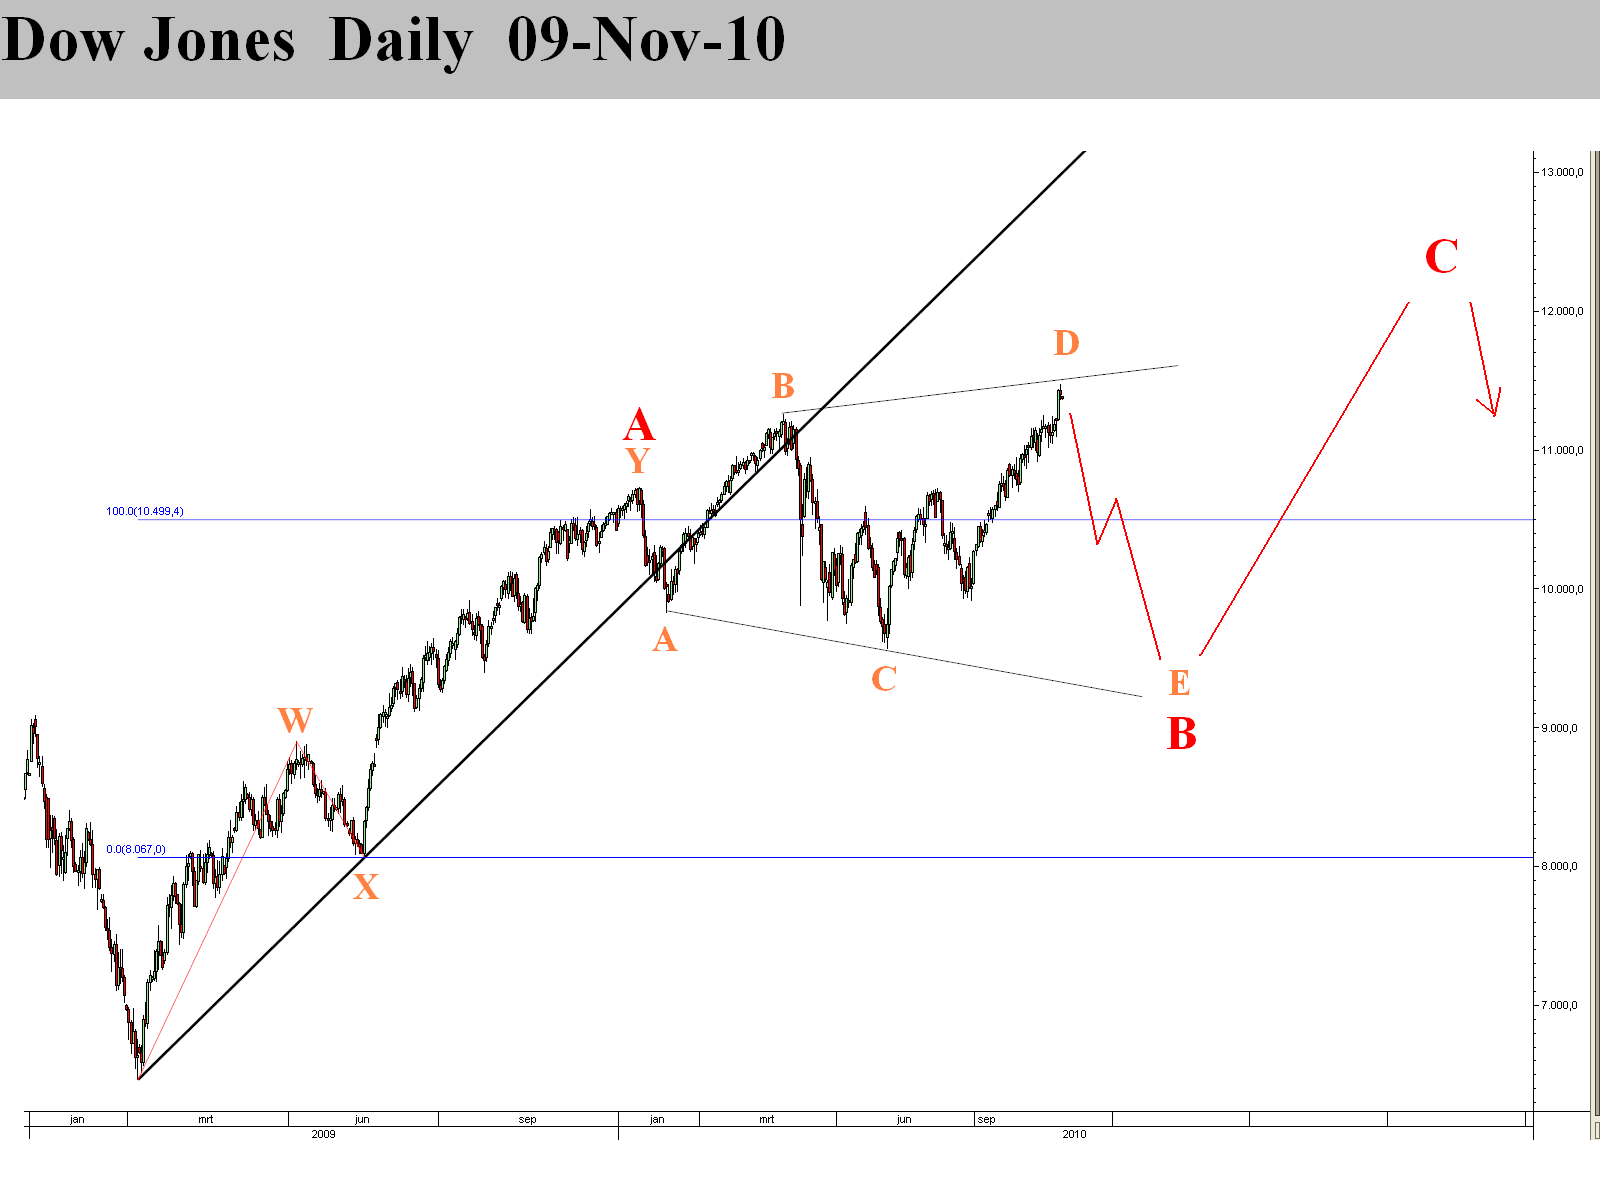
Dow Jones Surprise
Just like gold and eur/usd, the dow jones looks to be in a wave b, but what a wave b! An expanding triangle! These are rare, so i'm cautious with this count. On the other hand, it does fit very well with the counts i made on other markets...
Monday, November 8, 2010
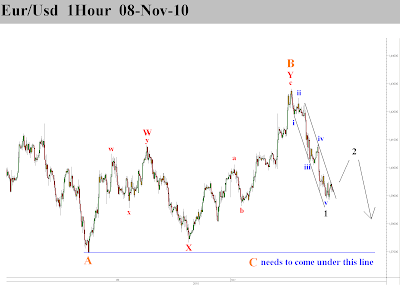
Sharp and Quick
I know the triangle count is valid, but like i said before, i'm sticking to my original count of the expanded wave B flat. Wave C in an expanded flat is usually very swift and brutal. This is true for the price action since the top, but price needs to come below the wave A low to confirm the expanded flat. 1.3535 would be a possible target ( 161.8% fib ext of A ). The first part, wave 1 of C, could be finished now, look for the channel to break to the upside, but remember that this count suggests a sharp downtrend, so wave 2 of C should be short in time.

Sunday, November 7, 2010
Aud/Usd Glory before the fall
Aud/Usd is a bit hard to count, but this expanded flat scenario looks good to me. It looks like price should go a little higher in wave C of B. This wave C could ofcourse also turn into a wave Y but the implication would remain the same. The strength of the australian dollar compared to that of the euro is remarkable, but both seem to be in B waves, which means that when this wave B is finished, the australian dollar could fall much faster than the euro.


Gold to 1600?!
It's been a while since i posted a count for Gold (Xau/Usd). It looks like an ending diagonal might be playing out, as hard as it is to believe, gold might actually go as high as 1600$. All rules apply for the expanding diagonal, wave 5 > 3 > 1, wave 4 and 2 overlap and wave 4 > 2. All waves subdivide as corrective waves. Only thing left to do is spike through the 1-3 trendline. Notice how in wave 5, all waves up are almost equal but so are the waves down, big waves up small waves down. Price should do one more small wave down and one more big wave up.

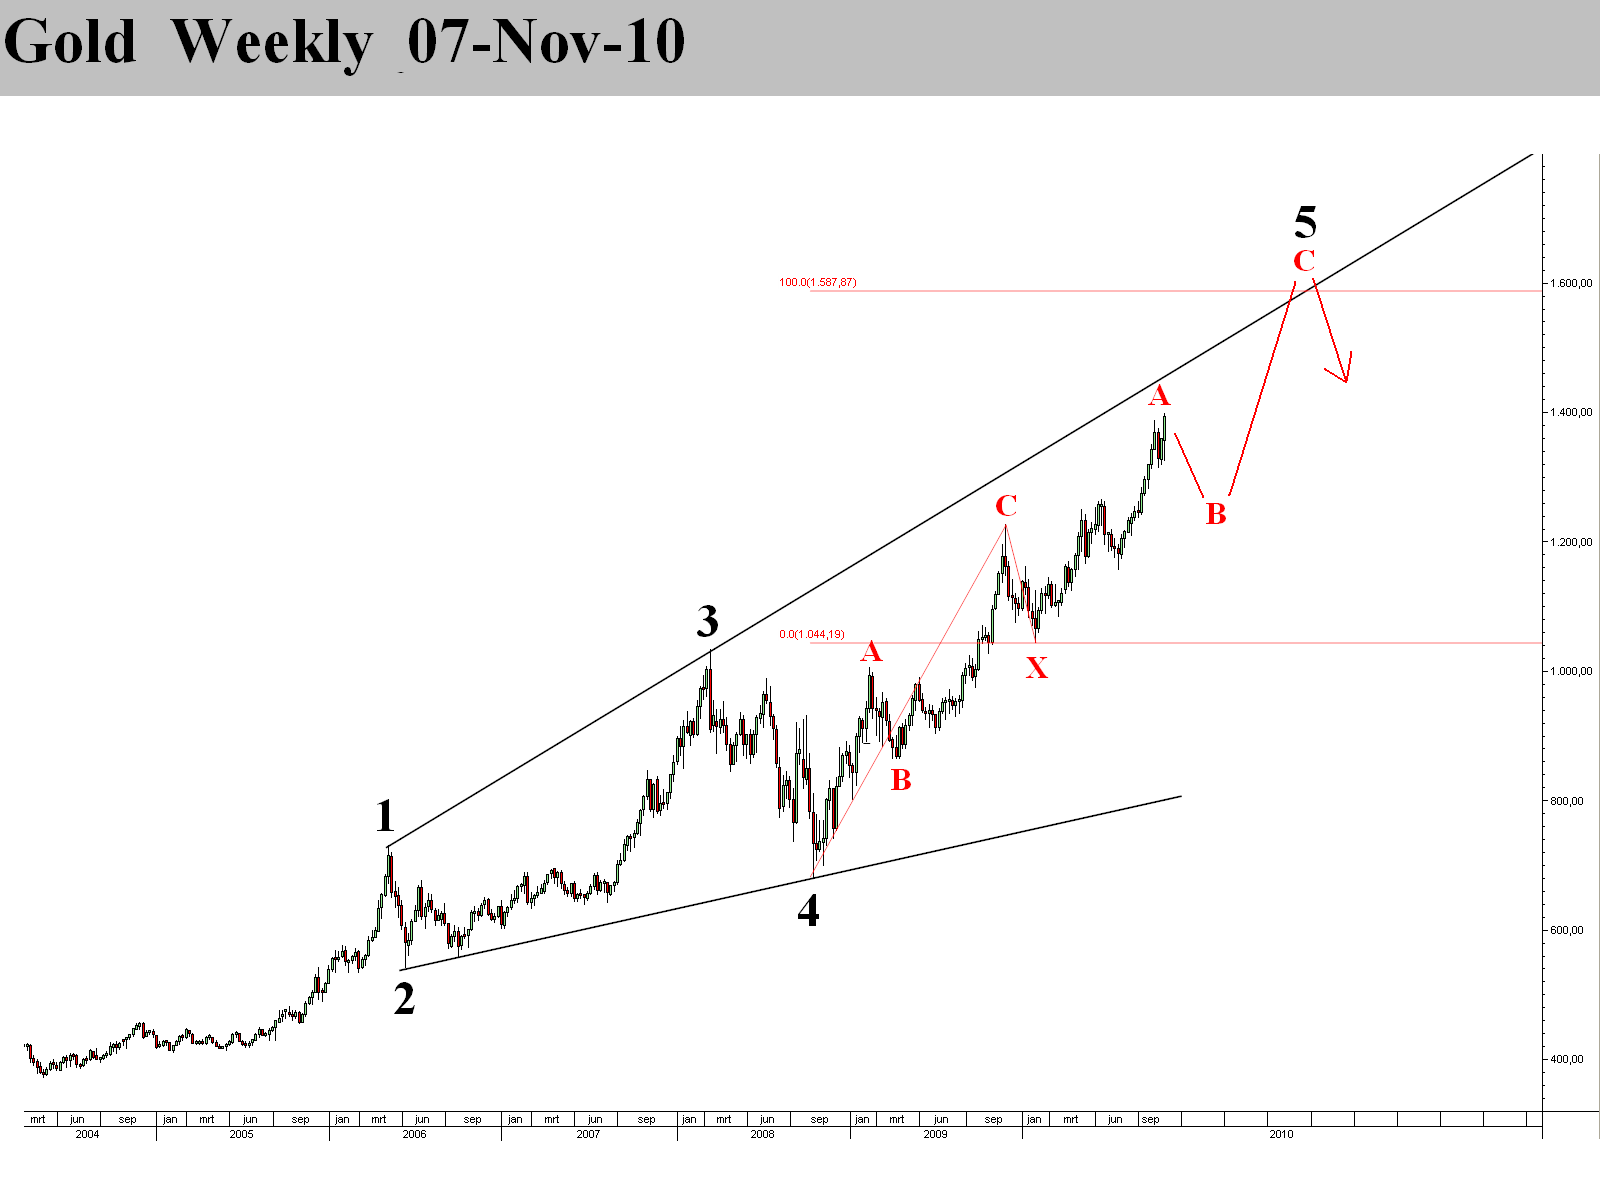
B of B
Since the near term structure is forming a top but the exact count is unclear, i decided to put up a weekly count. The top at 1.60 looks like it came after a 3 wave pattern, which started in 1985 and is probably part of an even bigger 3 wave pattern, but that is not clear since my data only goes back to 1972 (pre-euro uses deutshe mark data)... After topping at 1.60 the best count is 3 waves down to 1.1875, forming a wave A. The rally after this is also in 3 waves, but is too small to be considered as a finished wave B, that's why I labelled it as a wave A of B. Look for price to follow a path simular to the one laid out on this chart.


Tuesday, November 2, 2010
More time needed
The short term counts didn't work out, so it's back to the complex hourly timeframe. There are a lot of possiblities at this point again. The triangle count has different points where wave D and E can be placed. Even an ending diagonal could be placed with different starting points and different sizes. But I'm holding on to my believes that the top is in and this is some sort of a B wave. The correct count will be revealed to us soon...


Monday, November 1, 2010
Corrective
And here's how i would count price from the top if the first part is considered a 3 wave.
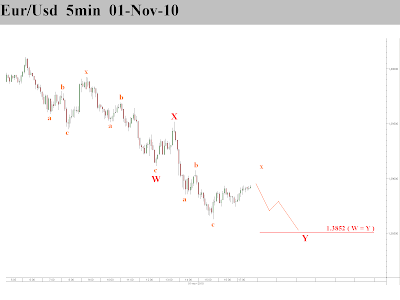

Zooming in
I'm focusing on smaller timeframes now to better understand what wave we're in. The problem is that the first part since the top is unclear. It could be counted as 3 or 5. Here's a count which counts the first part as an impulsive 5 wave.


Triangle too obvious?

Subscribe to:
Posts (Atom)