
Tuesday, August 30, 2011
Eur/Usd : Where's the top?
It is possible that price has allready topped, but it could also go up to one of the 2 resistance levels. Look at a break of the trendlines for signs of more weakeness.

Monday, August 29, 2011
Eur/Usd : Triangle invalidated
As noted in the last post for eur/usd, the triangle count was allready in danger and today the count got invalidated. This leaves us with the 2nd count where we are now in wave X as a complex triple three. There are a couple of ways this could go. A first possibility is price will go straight to the 1.46 resistance zone and reverse sharply after rejecting higher prices. Other possibilities are for price to go to the 1.4720-1.4750 zone or go down a little first before reaching one of the 2 target zones.


Sunday, August 28, 2011
Xau/Usd : Downtrend?
Ofcourse the big question for gold is if the major top is in. The decline certainly looks corrective, but this is normal since the rally to the top was a wave 5 expanding diagonal ( 1980 top was wave 3 top ). Resistance of the 61.8% fib from the decline is around 1830. This level has some other fibonacci extension resistance levels.


Aud/Usd : Focus on trendlines
Price had a corrective rally from the bottom, which seems nearly complete. There's a possibility that wave Y of B has another leg higher, but the trendline that got broken and retested is offering resistance. The new trendline is now offering support, should this get broken the decline will accelerate.


Usd/Cad : 2 Triangles
The range in Usd/Cad can be counted as a bearish triangle or a bullish triangle. For the bullish triangle, price has rallied out in 3 waves, making the triangle an X wave. The bearish triangle count has price going lower first, but higher after completion of the correction.


Friday, August 26, 2011
Eur/Usd : Lower but how far
The corrective mess continues and there are 2 possibilities i see for this range. Either a bearish complex double three, where the triangle wave X count i've been following is complete and this is the first part of wave Y. Second is the alternative count on the chart, a triangle where price will rally to around 1.4720.


Wednesday, August 24, 2011
Gold : Lonely Bear At The Top
It seems that in the latest weeks all the remaining bears have been converted into bulls. I've heared predictions of gold going to 20.000 $/ounce. It is known that at major tops, the majority of the players are bullish and believe price will go much much higher, the current situation certainly fits this description. I believe that this strong, furious rally is the last wave of strength and will be followed by an equally impressive decline. The EW count remains the same as i've had for a long time but went higher than expected. This is probably because wave Y of Y of 5 in the expanding ending diagonal is an flat. And both waves Y are 150% of their waves W, this is less common but then again a big top like this one isn't very common either. Another thing i want to point out is that gold and stocks have moved pretty much together for the last 2 years. Stocks have started what seems to be a big downtrend. Will gold follow? I believe it will.


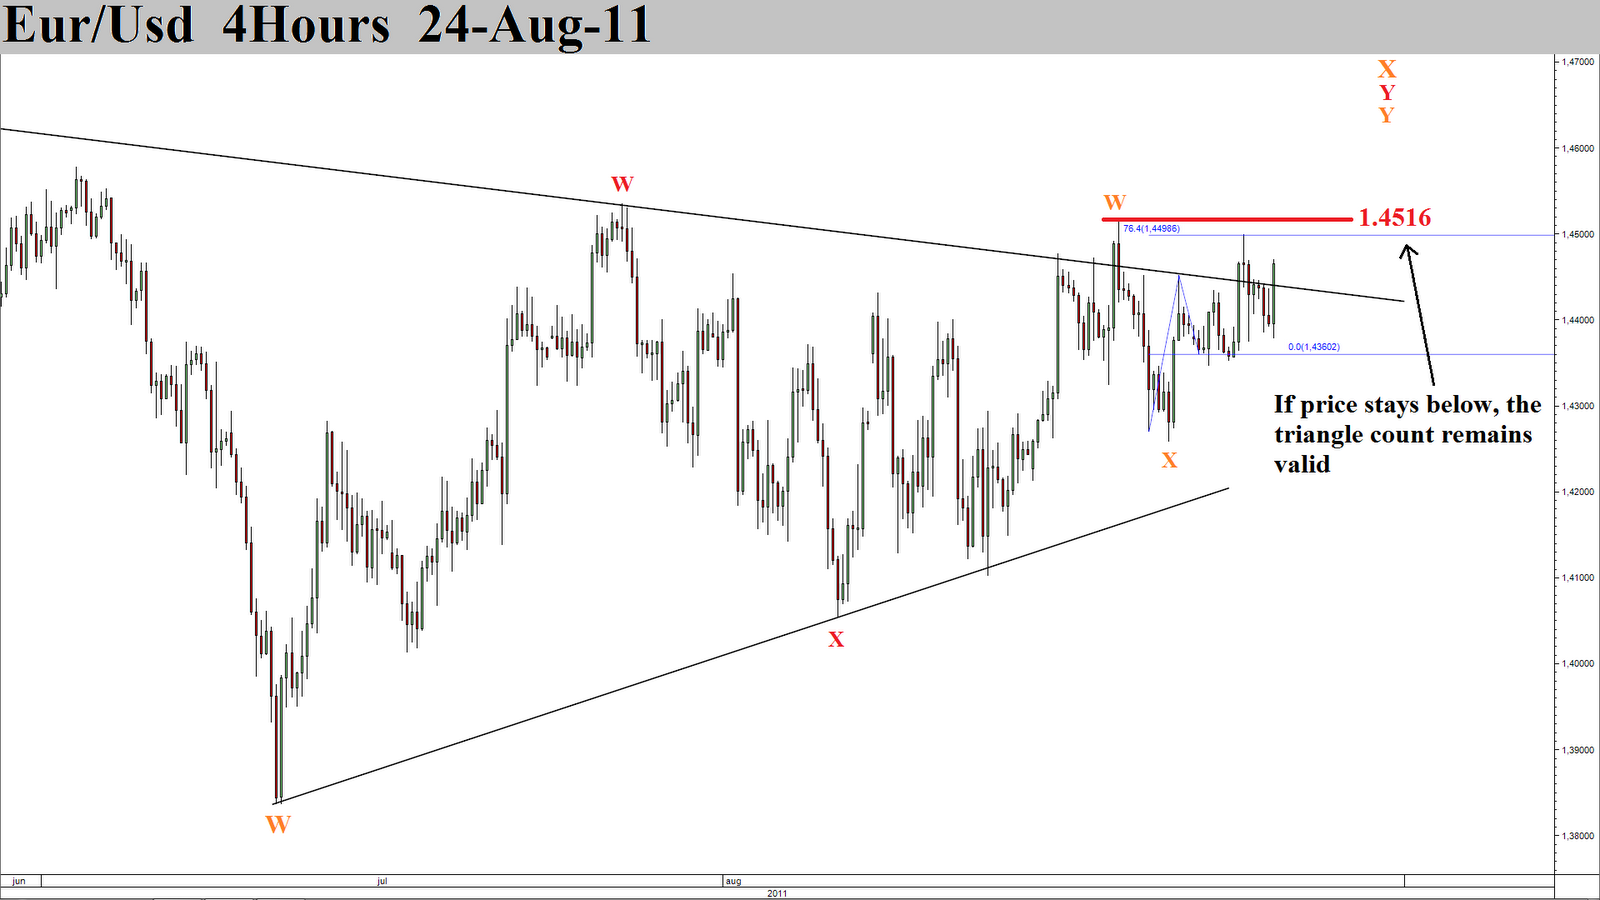
Eur/Usd : Triangle in danger
Price isn't declining like it should, which puts the triangle count in doubt. As long as price remains below 1.4516 it is valid, but price will have to start to decline soon. Even if the key 1.4516 level breaks, i believe price is close to a wave X top.

Monday, August 22, 2011
Eur/Usd : 5min chart
On this short term chart we can see a nice expanded flat wave (x), where wave c = 2.618 of a and (x) ends around the 76.4% fib retracement of (w). Look for prices to decline and go below 1.4360.


Sunday, August 21, 2011
Eur/Usd : Looking for a decline
The triangle count is still in play and the decline is corrective, so the triangle should be labelled triangle wave X. The alternative count is still possible aswell. 1.4535 is limit for the triangle count. A break of 1.4054 and the B-D trendline are confirmation. Don't forget that with corrective mess like this, there are a lot of alternative counts. Different bigger triangles and complex double threes for example.


Thursday, August 18, 2011
Eur/Usd : Wave Y
There was another leg up, but price remained below the 1.4535 wave C high, which keeps the triangle count in play. Look for price to break the 1.4323 low for confirmation.


Wednesday, August 17, 2011
Eur/Usd : Resistance
The triangle in the count proposed yesterday could be complete. There are 2 equal legs from the wave D low forming wave E. If the triangle count is correct, price should start a decline that will last for several days and have 1.3506 as target. If the triangle count isn't correct, price should break resistance, which starts at the trendline and previous highs around 1.4470. A possible target would then be 1.4753.


Monday, August 15, 2011
Eur/Usd : Is the bear alive?
Price rallied higher than expected. So it's time to step back a little and watch the entire decline from the 1.4939 top. I see 2 main possibilities, first a possible bearish triangle wave X where the triangle is finished and the decline should start tomorrow. Second possibility is a corrective wave X that has higher to go.


Eur/Usd : Down again
The expanding triangle idea didn't work out. So i have changed the count a little bit. Price looks like it wants to go down.


Sunday, August 14, 2011
Eur/Chf : Bottoming?
Eur/Chf has had a very impressive decline as everyone seems to run to safety away from the euro and into the swiss franc. But at the end of last week there was a big rally, forming a bullish hammer on the weekly chart. This is a strong signal indicating a possible bottom. The elliott wave count is complicated. At first i started counting the decline as an impulsive wave, where the fib levels are pretty good, but where price was stuck in a range between 1.50 and 1.60 kept giving me trouble. That's why i'm now counting this range as a triangle in a bigger complex correction.


Saturday, August 13, 2011
Gbp/Usd : Wave D of triangle
Since the 1.4228 low, price has gone up in a corrective way. There was a big trendline which got broken down and has been retested. Since the top was below the high of wave A, this would indicate that price is in a triangle where wave D has now started. The first part of wave D was in 2 equal legs down and appears to have retraced enough for the downtrend to resume.


Gold : Working the shoulder
Since the latest post for Xau/Usd, price has continued to rally in an explosive way. This is higher than i expected and price is now really stretching the long term count i've been following. There is a possibility for a head and shoulder pattern forming. This is would increase the chances that a top is in place. Should price go to a new high however, i will have to admit defeat and search for a new count.


Friday, August 12, 2011
Eur/Usd : Expanding triangle
I don't really like using rare patterns like an expanding triangle, but in this case i believe it could be possible. Price has to stay below 1.4293 for this count to remain valid.


Thursday, August 11, 2011
Eur/Usd : Wave X of Y complete?
Price has dropped as expected, even went below wave W of Y. After dropping price rebounded to test the trendline. The downtrend should resume soon. If the rally continues however, the alternative comes into play, which could have a bigger wave X.


Wednesday, August 10, 2011
Eur/Usd : Still in wave Y
Wave X ( or B ) of Y had another leg higher, but seems complete now. Price should stay below 1.4431, if it goes above an expanded flat as a wave Y is still possible.


Tuesday, August 9, 2011
Eur/Usd : Test of 1.40
Price has fallen nicely as predicted, but there should be more in this decline. Look for price to test 1.40 and maybje just below.


Monday, August 8, 2011
Eur/Usd : Complex triple three
Price went higher than expected so i was forced to change the count. It seems the correct way to count the decline from 1.4535 was a complex triple three. The rally from the 1.4054 low is corrective, the question now is where this fits into the bigger picture. Price broke out of the channel to the upside, but this doesn't have to mean a new high is coming, only the first part in a bigger decline is over, just like the count on this chart shows. Another possibility is that the wave X which i count as a top at 1.4535 has another leg higher in it.


Sunday, August 7, 2011
Aud/Usd : 2 beautiful legs
Since 2001 Aud/Usd has formed 2 corrective legs. The 2nd leg has now touched the 100% fib extention of the first leg and price reversed sharply. This pair could be set up for a long fall down.


Saturday, August 6, 2011
Usd/Cad : Ready to rally
Usd/Cad bounced of some big support and seems ready to start a multimonth rally. In the next coming weeks price should break the trendline and the latest high at 0,9911, confirming the trend has changed.


Eur/Usd : Down again
The trend is down and i expect price to continue making lower highs and lower lows. As for the elliott wave count, price is at or near the end of wave X of Y. Risk for higher prices start with the break of the channel and continues with the latest high at 1.4370. Rewards start at 1.4054, the latest low. After wave Y of Y is complete price should make another 3 waves up, it is possible that this will not reach very high and take a little more time, possibly turning in a triangle.


Thursday, August 4, 2011
Eur/Usd : Wave X of Y
The rally was wave X which puts price in a wave Y now. Inside this wave Y it appears the first part, wave W of Y is now finished.


Wednesday, August 3, 2011
Eur/Usd : Flag or Trap?
There are a lot of possibilities at the moment. Price is in a small downward channel, which could also be a flag in a bullish flag pattern. The problem is that when price breaks out of this possible flag it could be a bull trap as it could be a wave X as shown in the chart. Then again, this wave X could be complete allready.


Tuesday, August 2, 2011
Gbp/Jpy : Time to rally
It looks like Gbp/Jpy is also forming a bottom. How high this pair will go is uncertain. If you look at the weekly chart posted some time ago, you will see there are a few possibilities. With the weekly chart in mind, i believe the lows will get revisited eventually.


Usd/Jpy Double Bottom?
Usd/Jpy has 2 equal legs from the 85.81 top. If the corrective wave is complete, this would also leave a double bottom.

Eur/Usd : 2 scenarios
I see 2 possibilities at the moment. One has a bigger countertrend rally than the other.


Monday, August 1, 2011
EurUsd : Downtrend
Price has finally decided to decline. After retesting the trendline 2 times. Now price seems it is ready for a small relief rally. This should only be a small countertrend rally.


Subscribe to:
Posts (Atom)