
Monday, January 31, 2011
To the support zone
Price rallied but did so in a corrective way, as expected since i was looking for a wave B. Price should now go to the 1.34-1.35 support zone. When price gets there things will get interesting.

Aud/Usd
Here's an update for Aud/Usd . From the weekly standpoint not much has changed from the previous post. On the daily count you can see i have 2 alternatives to main count ( which has wave x (or b) finished allready ). Both are triangles, the first is a contracting triangle, the second an expanding triangle ( got the idea from a friend on twitter : @DEAFElliott ).


Saturday, January 29, 2011
How big will B be?
The wait is over and we finally got a decline big enough to confirm wave A has ended. The 100% Fib extention was the resistance that held. But now comes the crucial part. Following the main count from january 22th where wave (X) has allready finished, we should now be in a wave B. It is very possible that wave B will be very small due to the former resistance now support zone.


Thursday, January 27, 2011
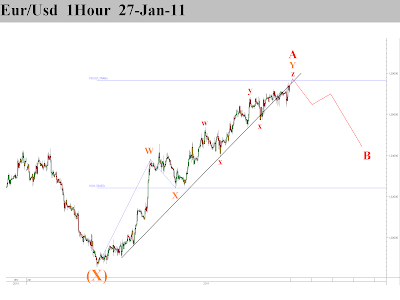
Slow Top
Wave Y has transformed into a slow and boring complex triple three. It appears the 100% fib extention of wave W is now the price level best suited for a reversal.

Tuesday, January 25, 2011
Looking for a break lower
Price is still in its topping process, but it's starting to show signs of weakness. The trendline has been broken briefly but price is back above it now. The next time price gets under this trendline and it breaks the latest low, the trend uptrend should be over/paused.


Monday, January 24, 2011
Topping
Inside this wave Y we have another wxy correction. We are now at the point where inside this wave Y, the waves w and y are equal. This falls together with wave Y being 0.764 the size of W. There is a good possibility that we have topped. It is also possible that price will go and test the 100% fib extention of W anyway. Remember to look for the trendline break to increase the odds that the uptrend is over or paused.


Saturday, January 22, 2011
1 day at a time
As the hourly count becomes more clear it's time to step back to the daily timeframe to know where price is headed over the longer term. Here's a possible count where wave (X) is finished. Price should go up in a corrective way up to the 1.45 or 1.50 zone and eventually test the upper channel line and break the falling trendline (the trendline should connect from the 1.60 high to the (B) of A high).


Another view is that wave (X) isn't finished yet and we are only finishing wave b of (X).

Friday, January 21, 2011
A little higher
The resistance zone is slowly breaking up and doing so in a corrective wave. While it is possible that price reverses right now and the daily candle doesn't close above resistance, i believe there's a little more left in this rally. After this wave A of Y finishes, look for a small wave B supported by the former resistance turned into support zone. The uptrend has a high probability of being over ( or paused ) when the black trendline breaks.


Thursday, January 20, 2011
Top of the range
Price has fallen from the resistance zone, but has done so in a corrective way. So the expanded wave b count becomes very unlikely. It is possible that from the low, a corrective wave is finished now. There's a possibility for 1 more high before finishing. This would be the first part of wave (Y). Like i noted yesterday, should price decline from here, look for a inverse head and shoulder pattern to come into play.


Wednesday, January 19, 2011
Expanded wave b ?
While this minor wave b (expanded) is getting higher and higher, the possibility that this is infact a wave b becomes smaller. I'm watching the resistance zone, if the daily bar closes above this and price doesn't plummet after doing so, i will change the count to the alternative. There are however many ways to count current price action. Trading on EW is dangerous now and i prefer to wait for times when there's more clairty.


Tuesday, January 18, 2011
Resistance
Price has rallied into the resistance again but resistance is holding. Price actually went higher than expected but the count remains the same. The main count is for price to go to the 1.27 - 1.28 regio. The alternative count has price in the early stages of wave (Y), B of A of (Y) to be more precise. With this alternative count, price should not go below 1.2858 and could form a inverse head and shouler pattern. Both counts have price going lower in the short term.


Sunday, January 16, 2011
Big Resistance
There's a big resistance zone around the 1.34 - 1.35 zone. If this resistance holds, price might go down to test the 1.27 regio in a wave Y of Y of (B). Should resistance break, the alternative count comes into play where wave (B) probably finished allready and we are correcting higher in wave (Y). There would no longer be a wave (B) low but a wave (X) low instead. EW counting is hard and complex but it's normal because we are in a wave (B) of B ( or (X) of B ).


Thursday, January 13, 2011
Top?
After a big rally today price might be ready to reverse around this price level. This top is either a wave B and we go to one of the scenarios of the previous post or this is a wave A in the new uptrend of wave (Y).


Bottoming process
First of all i just want to say i'm really happy to see this blog has passed the 10.000 visits mark! But let's get on to buisiness, there are 2 possibilties i'm looking at.
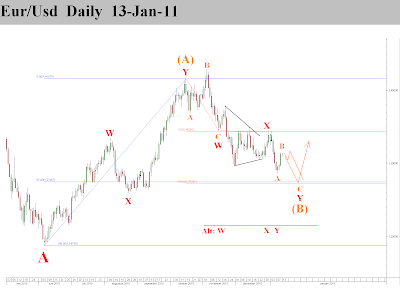

First is the triangle wave X count. Target is around 1.2750 unless the alternative comes into play where wave Y has allready finished. This would mean wave (B) should be counted as wave (X) since the rally is corrective and is part of a larger wave (Y) which will take us above 1.4157.
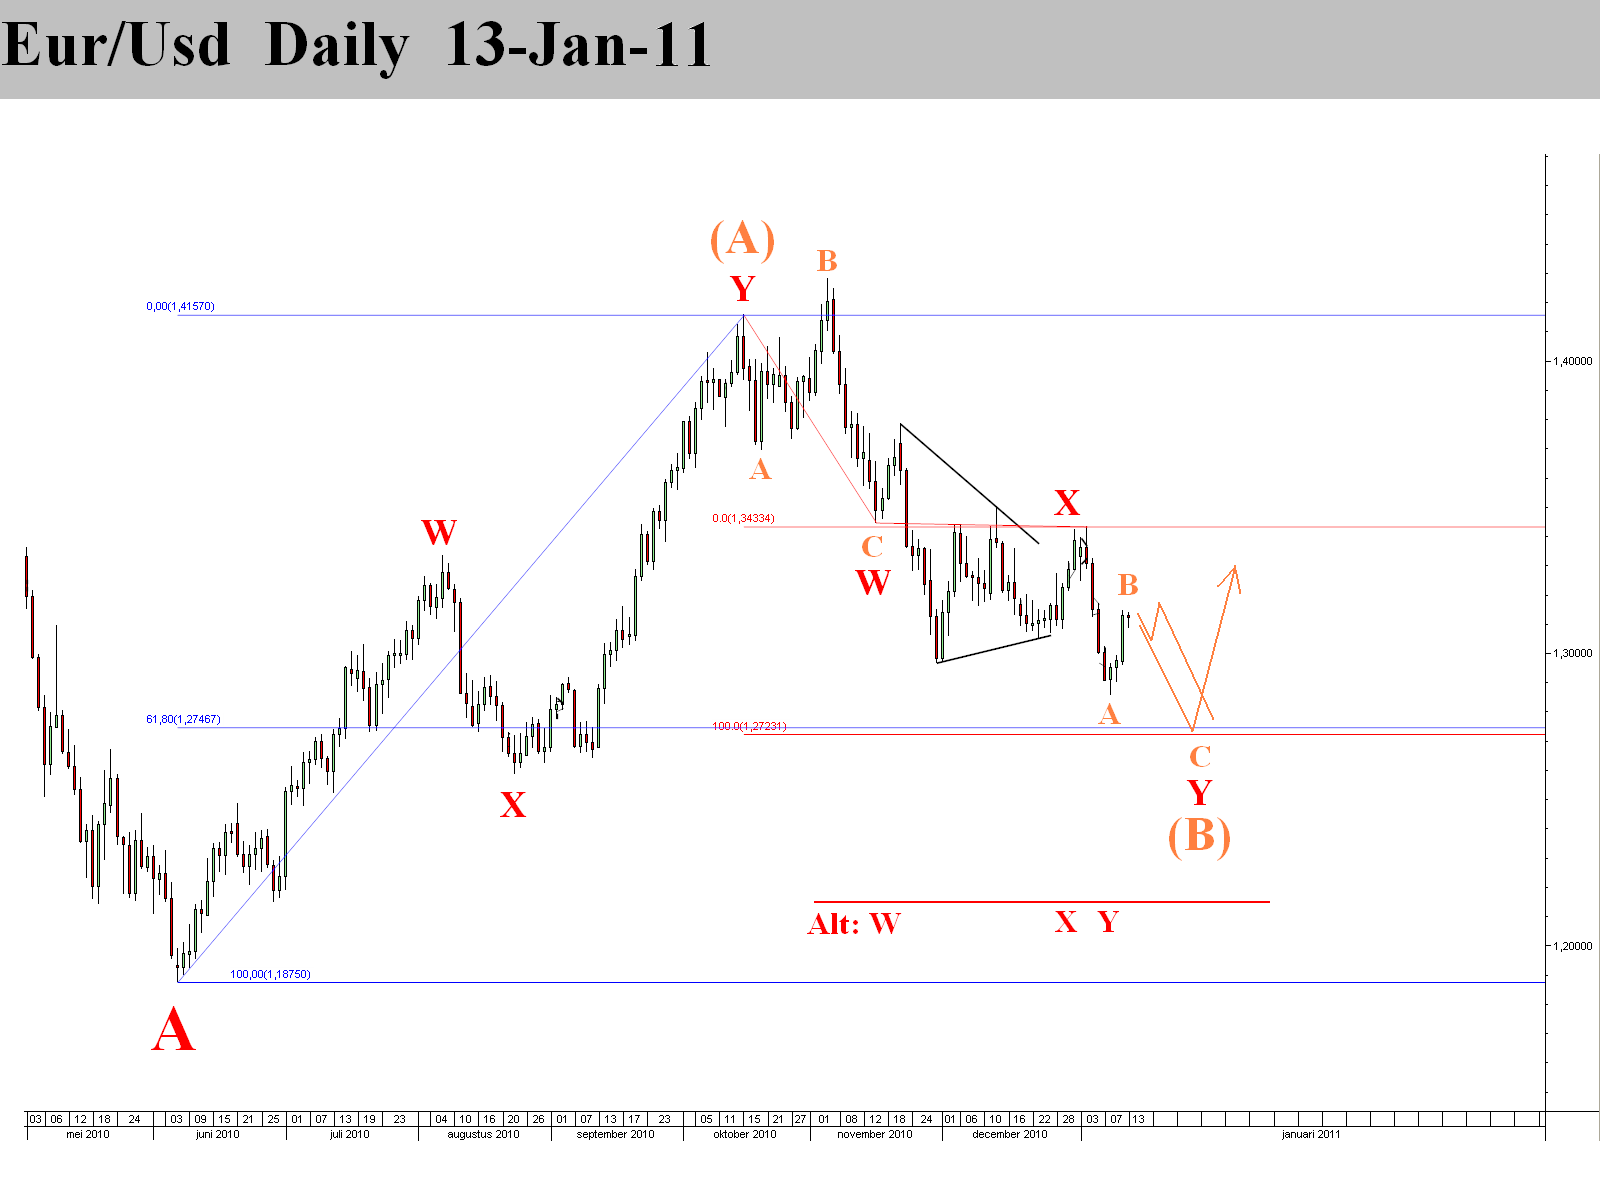
Second is a deeper wave W and a small wave X, price should go deeper to end the wave (B).

Tuesday, January 11, 2011
Small or Big correction
Since the last short term update price has gone up in a corrective way. This can mean 2 things, either the decline isn't finished yet ( = alternative count ) or the rally of what should be wave (C) will have to be counted as a wave (Y) this would allow a corrective wave as the start of the bigger wave.


Sunday, January 9, 2011
Wave (C) for Eur/Usd ?
With other USD crosses having a bullish possibilities with a last rally for a major top, i am now looking at a finished wave (B) as a possibility for eur/usd. You might have noticed that this is not the expanded wave B i was looking for on my intraday analysis, but rather an alternative count posted january 6th, which counts current price in wave C of (B). This wave C of (B) is a complete or nearly* complete 5 waves ( *it's possible that v of 5 extents lower)


Gbp/Usd to test 1.70?
Possibility of US dollar weakness coming also visible in cable (=Gbp/Usd). B of Y could finish a bit lower, but 1.70 is expected to be retested. An alternative count is that we are in a triangle, for this the wave W high cannot be exceeded.


Saturday, January 8, 2011
Rally to the top
Just like gold, Aud/Usd seems ready to start it's last rally before it will fall harder than anything you have ever seen. 1.1460 looks like a good place for a reversal.


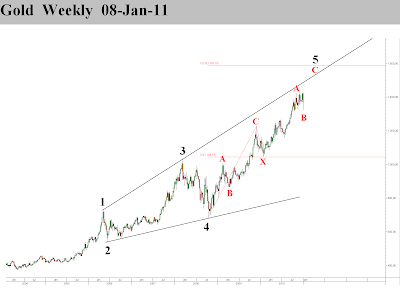
End of a golden age
Gold seems ready to start it's final rally, things could get ugly here. Look for almost everyone thinking gold will go 2500+ to find the top. An alternative count is that wave B isn't over yet and makes another low.

Friday, January 7, 2011
Last chance for wave B
The only thing the NFP event produced is a triangle. I would place this as a wave 4 triangle which means we are in a final wave 5 now. It is possible that this is nearly complete, but it could continue a little lower. These 5 waves could still be part of a now expanded wave B, but this would require price to rally hard in the beginning of next week.


Thursday, January 6, 2011
Pre NFP Bull and Bear
The triangle count and deeper x wave count are no longer valid, but i still think we are in an unfinished correction. The biggest problem is that the 200 DMA is broken, so that is reason for concern. But again this could be a trap like B waves usually are.
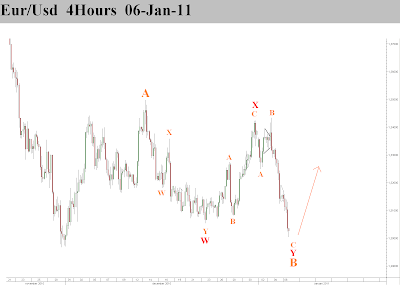
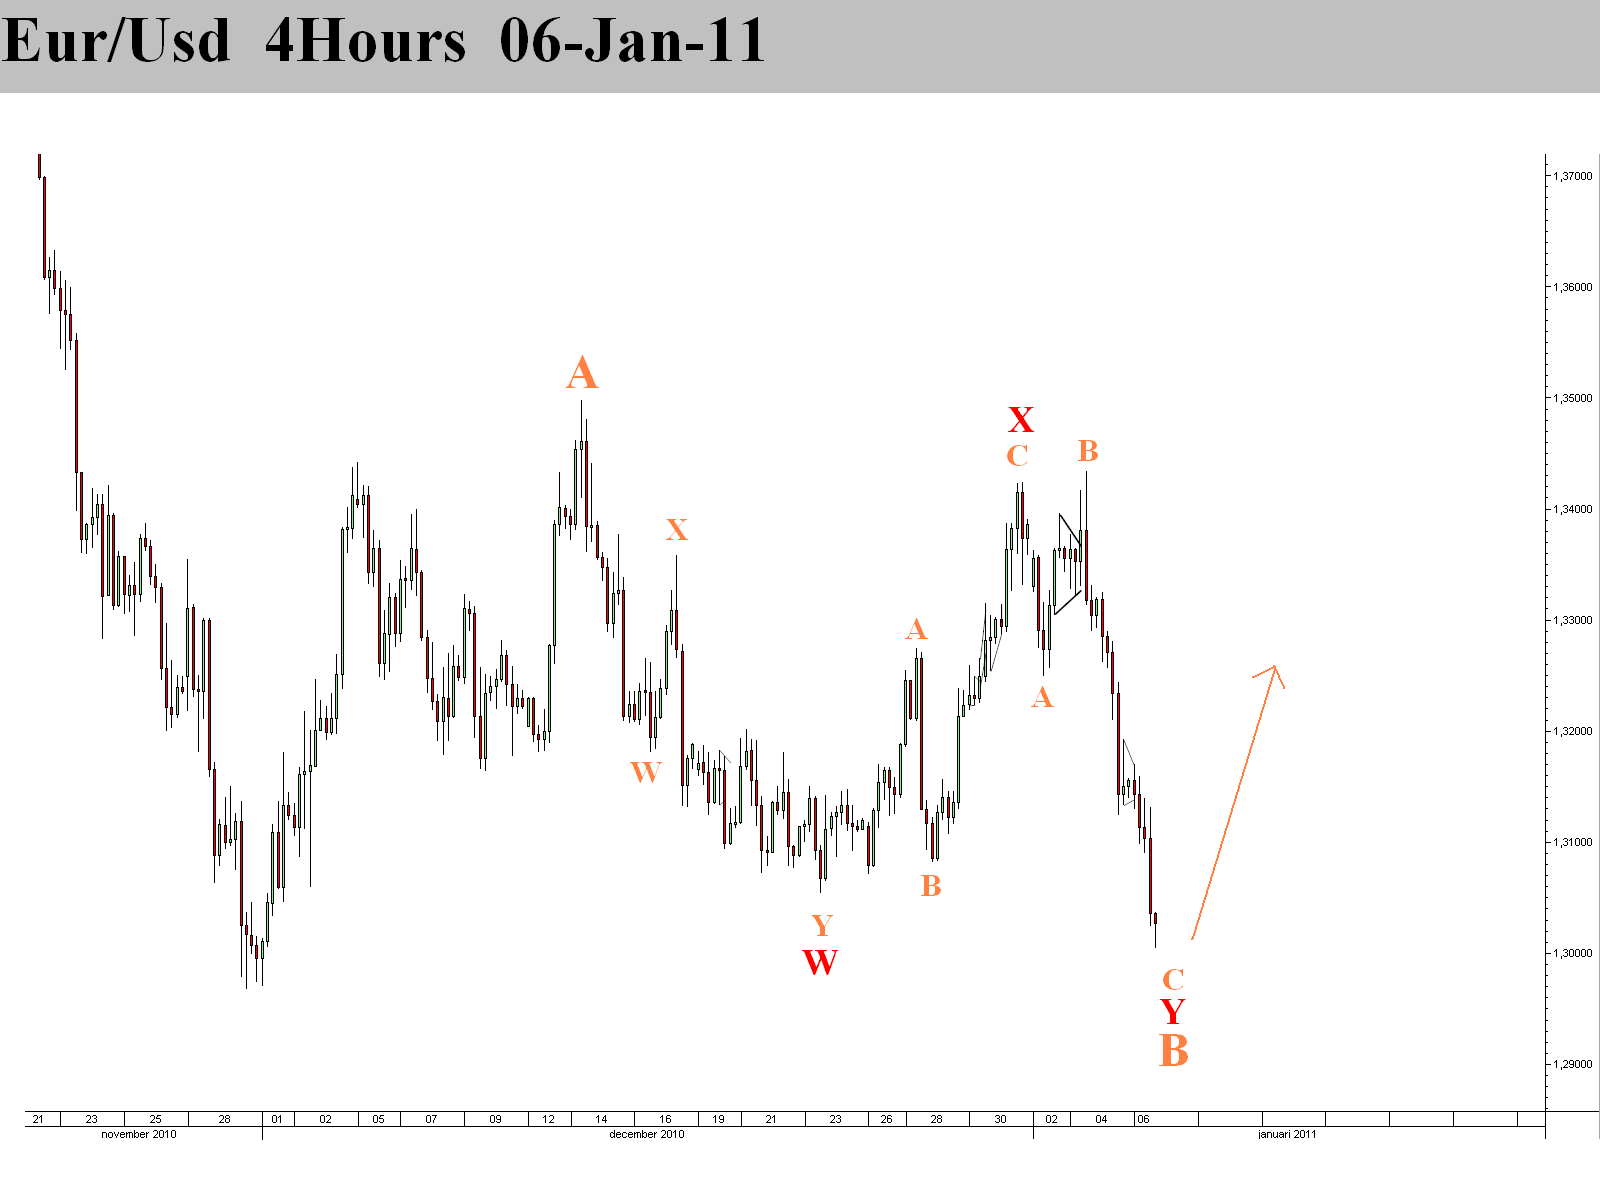
I am watching for any bearish alternatives anyway, a triangle could have been in the making for a long time.


NFP tomorrow which could be a big price mover, like it usually is. We'll know more on where the market wants to go.
Wednesday, January 5, 2011
A deeper X
Price fell sharply today, but seems to find some support now. All of the price action looks corrective to me. The last part of the decline is the hardest to count, but the overall pattern looks like a double three correction, a WXY. This puts us in wave Y where the first 2 parts should be finished and the 3th and last part of this Y should start soon. This rally will go above 1.3497. As an alternative i still keep the triangle in mind, but that would require some small adjustments to the count.


Tuesday, January 4, 2011
A Last Rally
Price made a new high and did so in 3 waves. This makes the possibility that the WXY scenario is coming into play a lot higher. This latest high would be a wave A and the wave B should be near or at an end. Wave C should take us to around 1.3583, the 100% fib extention of wave W that started at 1.2968.


Monday, January 3, 2011
A Patient Start
I hope everyone had a wonderfull start of the new year! Here's the first update of 2011. It looks like we have to wait just a little longer to know in what pattern we are exactly. Either a triangle or a WXY correction. I have plotted 2 expected price paths with the 2 possible counts. Short term price should decline.


Subscribe to:
Comments (Atom)