
Saturday, April 30, 2011
Major top around 1.50
Not much has changed since the previous post. Over the next few trading days price should have a small decline before starting the last rally to 1.50. I now start looking for possible events that can trigger a big decline. NFP is this friday, so that's a possible suspect. Exciting week ahead!

Wednesday, April 27, 2011
The last push higher
Price is getting closer and closer to the 1.50 target level. Now that wave X of Y of (Y) is finished, we have a target level for Y of Y of (Y) and guess what, it's at 1.5094, right in the target zone. Things are getting really interesting.


Sunday, April 24, 2011
Will the trend go on?
While it is possible that price has topped, with the latest daily shooting star candle, price at the 61.8 retracement of 1.60 - 1.18 and wave Y at the 76.4 extention of W , i still don't think that this is the major top i'm looking for but rather just a pause in the uptrend in the form of a wave X.


Monday, April 18, 2011
Dangerous wave X
What a powerfull decline we had today! Probably because the trendline that started in january got broken to the downside. There also was some news about the S&P putting the outlook for the US on negative. Anyway, the question now is wether this is still a wave X. Price action from the top is clearly corrective, so a wave x is certainly possible. We most not forget that we are in corrective mode since the 1.60 top, so this could also be the start of a new downtrend in the form of a wave Y. The next couple of days will tell us more if price can still get to 1.50 or if price will just continue to plunge. 

Saturday, April 16, 2011
Closer to the 1600 target
Gold (Xau/Usd) is getting closer to a major top. The expanding ending diagonal has been following the path nicely and has been exploding higher in recent weeks/months. This is what is expected in a 5th wave of an expanding ending diagonal. Since diagonals count like triangles with an internal structure of 3-3-3-3-3, it is normal that the 5th wave is a corrective wave. More in detail, there are a lot of complex double 3's (WXY) on different levels, all with nice fibonacci relationships.  As for the last part, the rally from 1308, on the daily chart i can count an ABC corrective wave, with a wave C 161.8% of A target around 1600 aswell. This count seems very hard on smaller timeframes, so this is still open for alternative complex corrective counts. But since the weekly chart shows a clear target of 1600, i wouldn't be surprised if this little ugly duck turns into a beautifull swan...
 As for the last part, the rally from 1308, on the daily chart i can count an ABC corrective wave, with a wave C 161.8% of A target around 1600 aswell. This count seems very hard on smaller timeframes, so this is still open for alternative complex corrective counts. But since the weekly chart shows a clear target of 1600, i wouldn't be surprised if this little ugly duck turns into a beautifull swan...
Thursday, April 14, 2011
Better complex
The triangle scenario didn't work out, instead we went lower and the correction transformed into a complex double three corrective wave. The size of what this wave X should look like is a lot better looking then the small triangle was. Expect price to go lower and test the weekly trendline that was broken a few days ago.


Wednesday, April 13, 2011
A small triangle
Since the top price has been corrective with a triangle or even a complex double three as possbilities. If this turns out to be a triangle i would consider this as a small wave X, very small but it would work very well with the 1.50 target.


Tuesday, April 12, 2011
Top
We did get a 5th wave higher but not out of a triangle. Price has reversed a little before the ideal 161.8 target, but the elliott wave pattern looks complete now. If the main count is correct, we are now in a wave X with eventually one more wave higher before a major top will form. This should be around 1.50, like predicted a very long time ago.


Monday, April 11, 2011
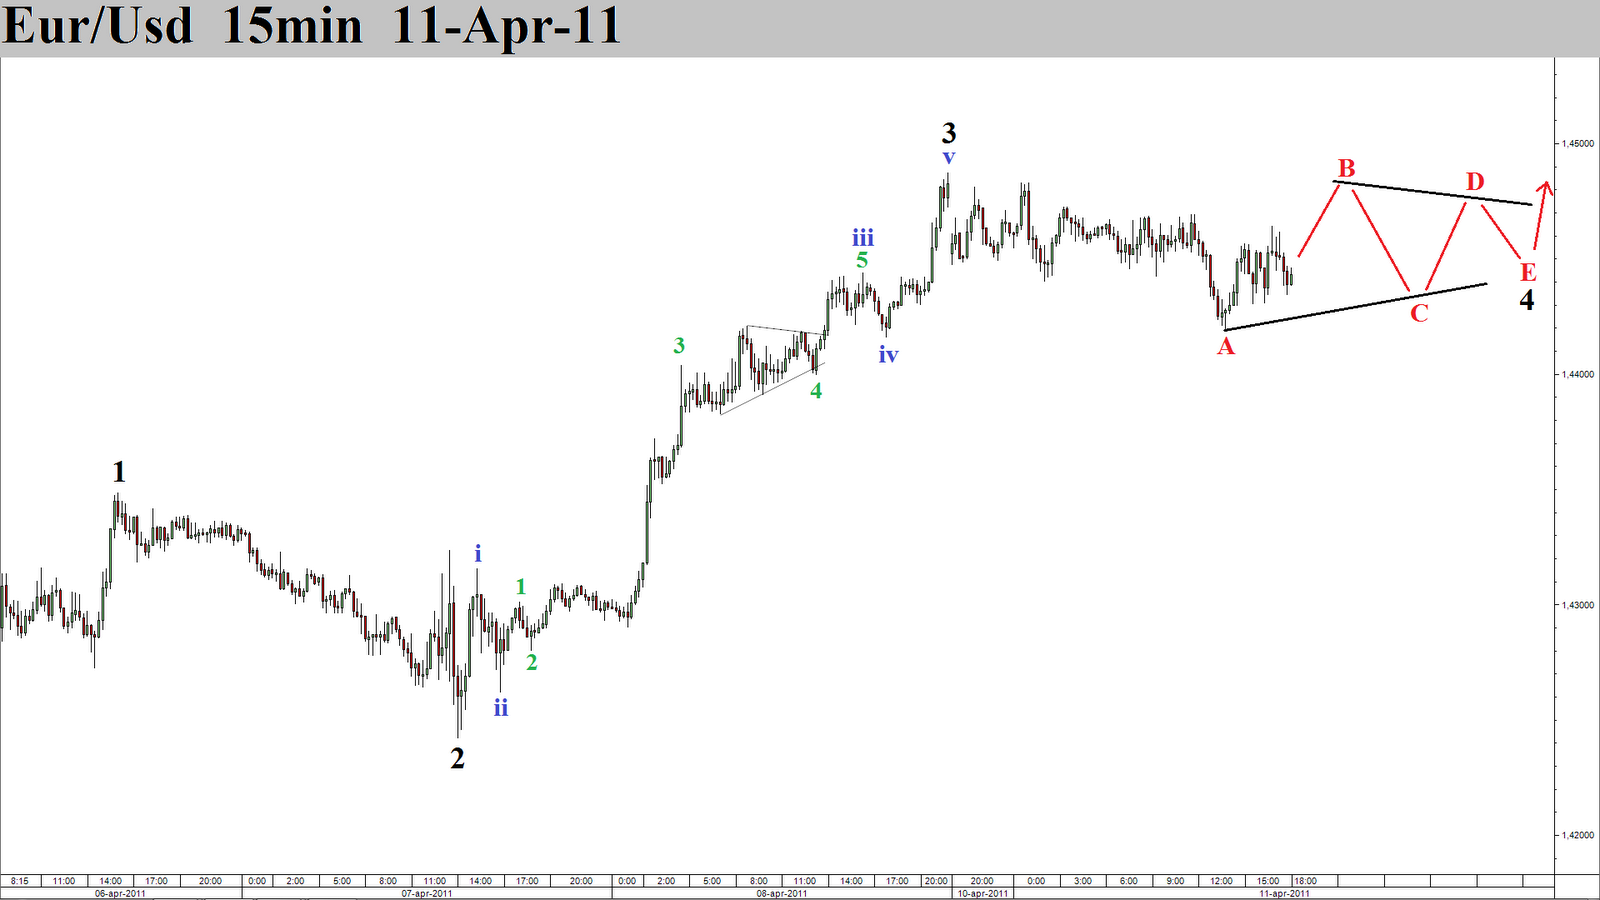
Wave 4 triangle
Price has come down in 3 waves but the rally from the low is also in 3 waves. A possibility is a triangle, but it could transform into another corrective wave. 
Saturday, April 9, 2011
The road to 1.50
With the daily trendline broken to the upside, i have decided to count the wave X complete. Like i recently said, it's a very small wave X but it is possible. Since forming the wave X low, price has been corrective followed by more impulsive price action. To me this translates into a 3-3-5, which is an abc flat. A common target for a wave C in a flat is the 161.8% fib extention of wave A. This would give a possible ending for this flat around 1.4560. This flat should be part of a bigger ongoing corrective wave, this flat would be wave W of Y of (Y) of B. The following wave X should go and test the broken trendline. After this price should be ready for a final run higher to 1.50. The alternative, a complex triple three, should also be considered and would fit nicely with the smaller wave x. 


Wednesday, April 6, 2011
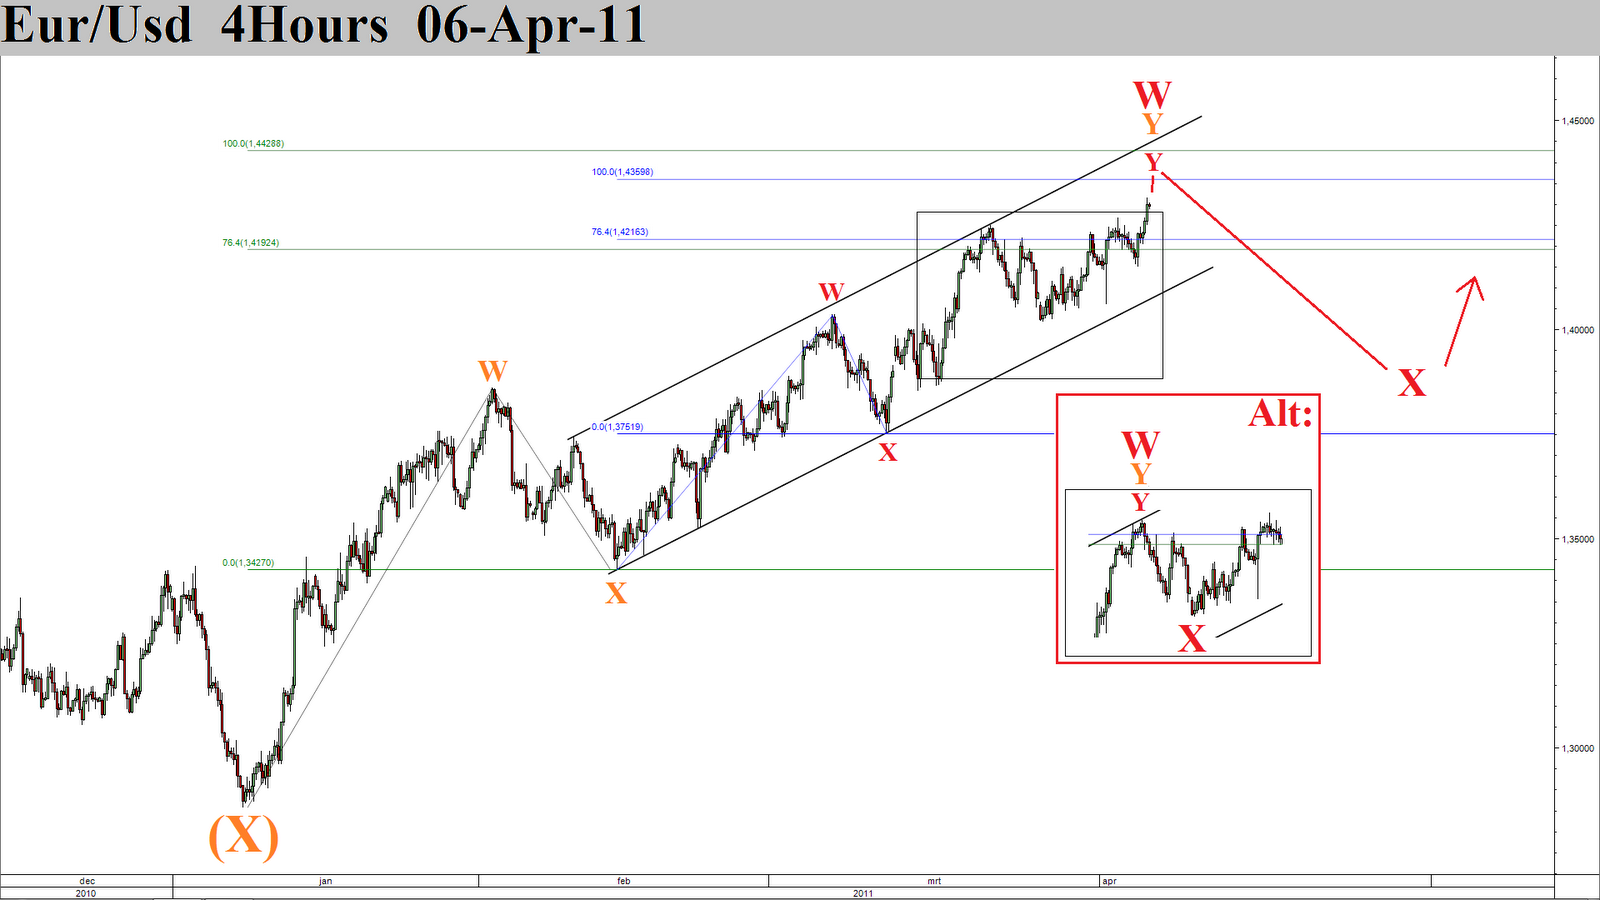
A higher W
The triangle count got invalidated, so i am now going with the alternative where wave W isn't finished yet. While it could be possible that wave W has allready topped, this would mean that wave X was very small. This is unlikely, but not impossible. Don't forget tomorrows ECB event, which could be a market mover. 
Tuesday, April 5, 2011
Triangle wave X
Since the top price has declined in a corrective way. And even with this recent sharp rally from 1.4150, i believe price will remain in a range for some time to come, making this sharp rally just part of a wave C of a triangle. As for the alternatives, it is still possible that the latest high is a wave X and we are now in a wave Y, this would mean price will break the big trendline. Another alternative is that wave W wasn't finished yet and this is the latest leg of wave W. 

Saturday, April 2, 2011
Double top?
The corrective wave up got another leg. But price hasn't gone high enough to change the count. So i remain with my view that we have finished a 3-3-..., with a flat, triangle or complex wave as possibilities for the bigger wave X. 

Subscribe to:
Posts (Atom)