
Friday, July 30, 2010
Possible Top
July 26th i posted a chart with an alternative count on it. It appears this could be the correct count afterall. The top is in or we get one more small high which has to stay below 1.3215.

Tuesday, July 27, 2010
Where are we now?
The bigger picture isn't too clear at the moment, too many options and the main count is getting suspisious (wave c getting really big). So that's why i zoomed in to a 1 hour chart. Here I can see 2 waves consisting out of 5 waves which i label as a 1-2-i combination. We'll have to see how this plays out before going back to the larger timeframes.


Monday, July 26, 2010
Big Resistance, Break Or Resist
Price is still struggling to break out of the rising channel. And it is possible that there will be another fake breakout to complete a minor wave ii. I've added an alternative count which counts the internal structure a little bit different because it's not very clear. If this is the case, then wave 3 is smaller than wave 1, so wave 5 has to be shorter than wave 3, else wave 3 would be the shortest wave and this is not allowed.


Thursday, July 22, 2010
Nervously awaiting the stresstest results
With possible big moves ahead as a result of the european bank stress tests I have a really bullish count and a big bearish count (= alt). There's a break of the rising channel which has to be watched carefully. We should know more about the futur direction of the trend very soon.


Tuesday, July 20, 2010
Make or Break the trend
Price needs to start rallying soon or both counts will be invalidated. The 2 red lines are the limits for the 2 counts, if price goes below the highest red line, the wave iv scenario is invalidated, if price goes beneath the other red line both counts are invalidated. The black lined channel is clear and a break of it could drive price lower quickly. One small observation is that price seems to find some support on the old green channel.

Sunday, July 18, 2010
Summer Rally
A couple of days ago I said there would be surprises to the upside. Since then, price has rallied out of a very small wave 2. It appears the rally isn't done yet. In this count I have us in wave 2 of iii of 3 of C, to keep things simple. Once this minor wave 2 is done, there should be another violent rally higher. Another possibility is that the last top was the end of wave iii, this would mean higher prices nonetheless but maybe not as high or violent as in the other count. There are ofcourse other counts, but this is the faith of an EW'er, always chose the count with the highest probability.


Wednesday, July 14, 2010
Thin red line
Price rallied in what appears to be a complete 5 waves. I see 2 possibilities, first is my main count, supported by the break of and close above the daily trendline, that puts us in wave 3 of C. Second is the alternative count, supported by the rejection of the 100% fib, where wave C is complete. The red line will give us confirmation about the direction.


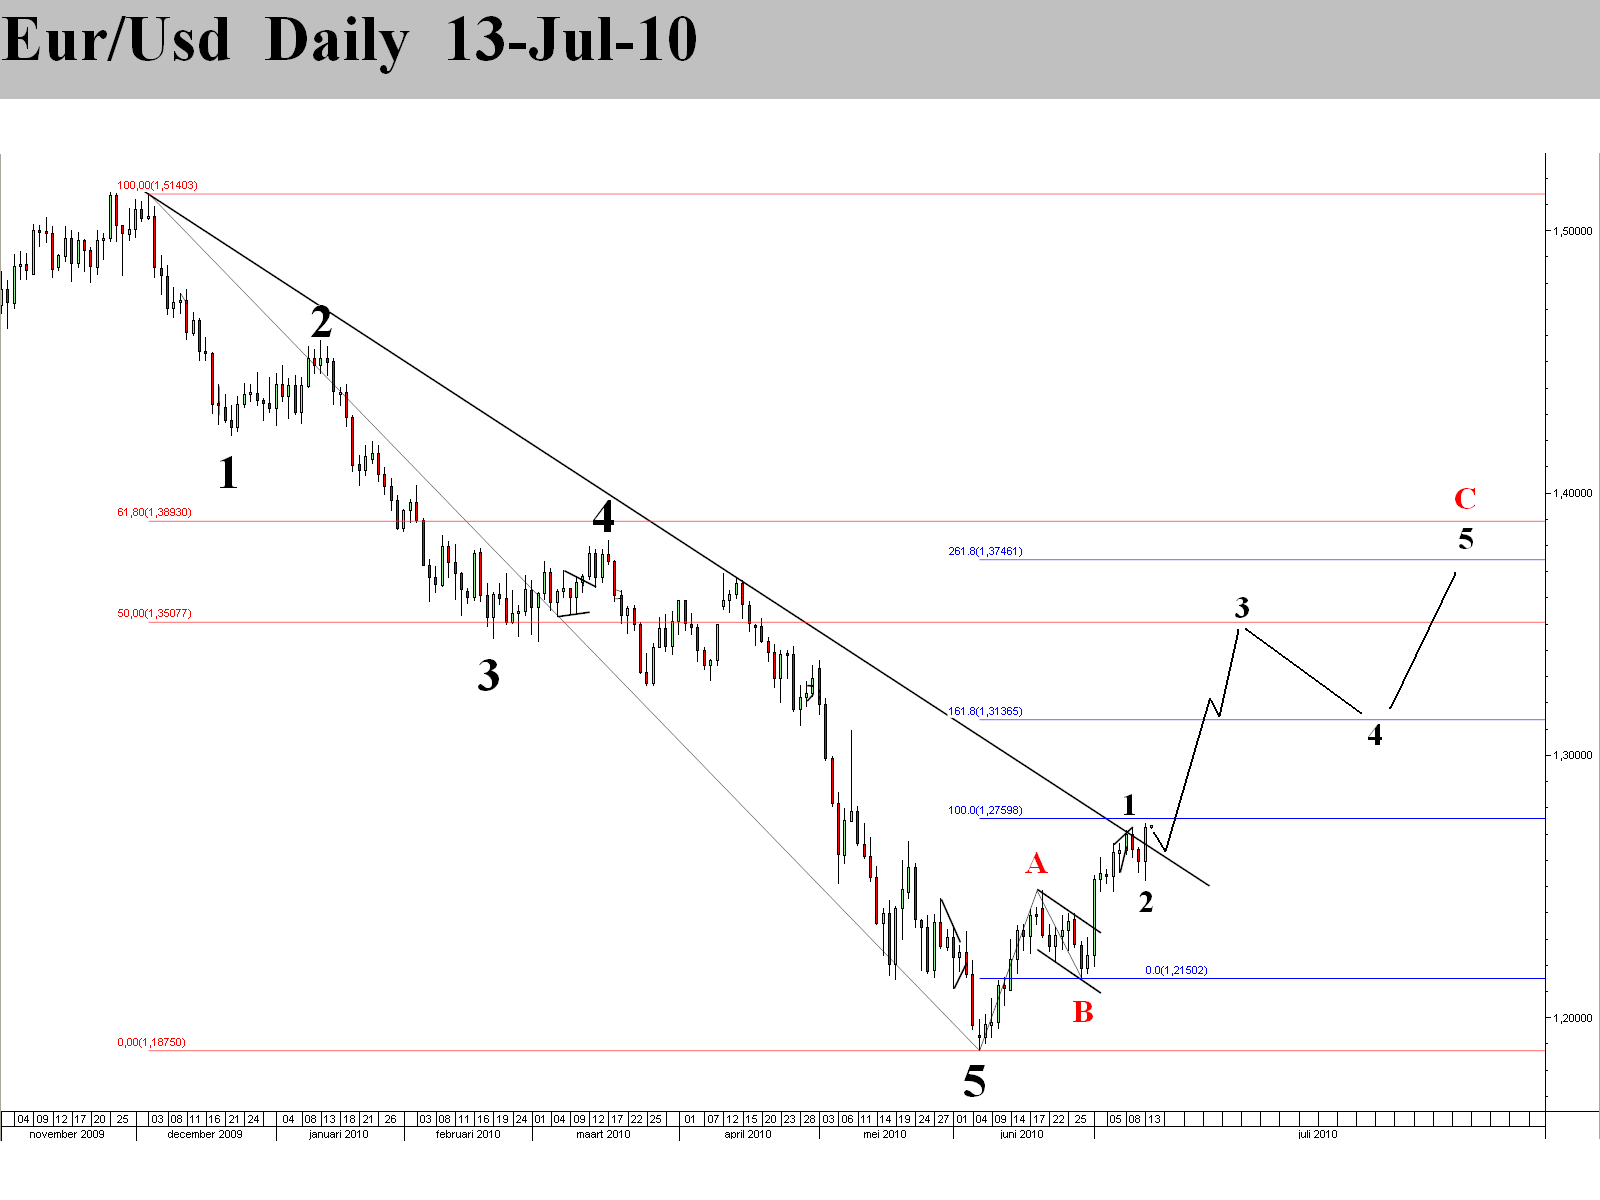
Tuesday, July 13, 2010
The bull wants to go higher
Price went over the top of the diagonal. This means the rally isn't done yet. Also, the daily candle closed above the falling trendline, which is bullish. I'm now counting the 5 wave rally from the wave B low as wave 1 of C. Wave 2 is very small but since we're at a new high, it should be complete. This would put us in wave 3 of C now, so expect surprises to the upside.

Monday, July 12, 2010

Thursday, July 8, 2010
The top of the flag pattern
Since the triangle/flat count didn't work out, the only option left is an ending diagonal. It is possible, but unlikely, that it is allready complete. More likely is a test of the 100% fib extention around 1.2760, where wave A = wave C.


Wednesday, July 7, 2010
Wait and see
The last rally looks like a 3 wave pattern to me. Either an expanded triangle or expanded flat seem like good possibilities. It's still a bit early to be sure and it's too risky for me to trade this setup. Best thing to do is wait for clarity...


Tuesday, July 6, 2010
B carefull
I'm watching price action after the top closely to determine wether we're in a wave B or wave v. For now it looks as if price action is more corrective, so i'm now carefully calling this a B wave.


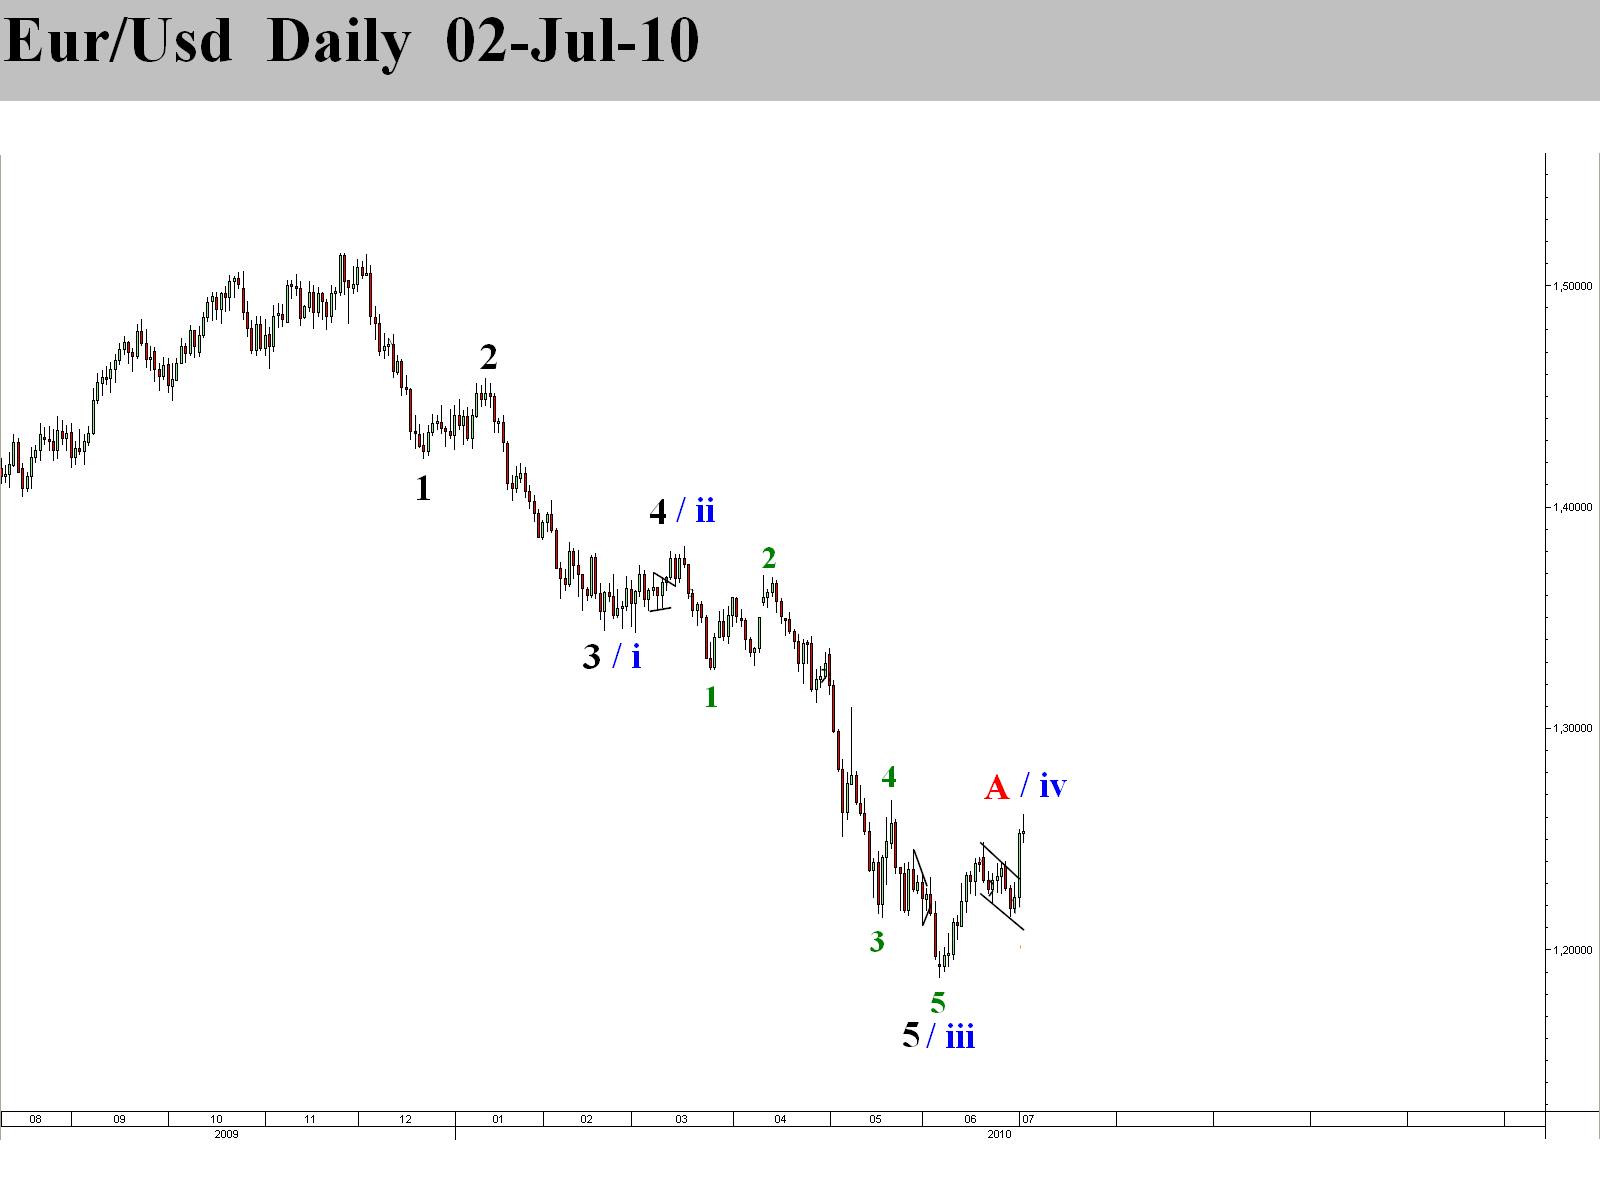
Friday, July 2, 2010
A Step Back
Here's is the daily count as promised. There are ofcourse other counts but these are the 2 i like most. Either wave iv of 3 finished or wave A of a bigger 3 wave correction higher finished. We will know soon enough. If the decline is in 3 waves it's highly possible it's wave B, if it's impulsive the probability is high that it is wave v of 3.

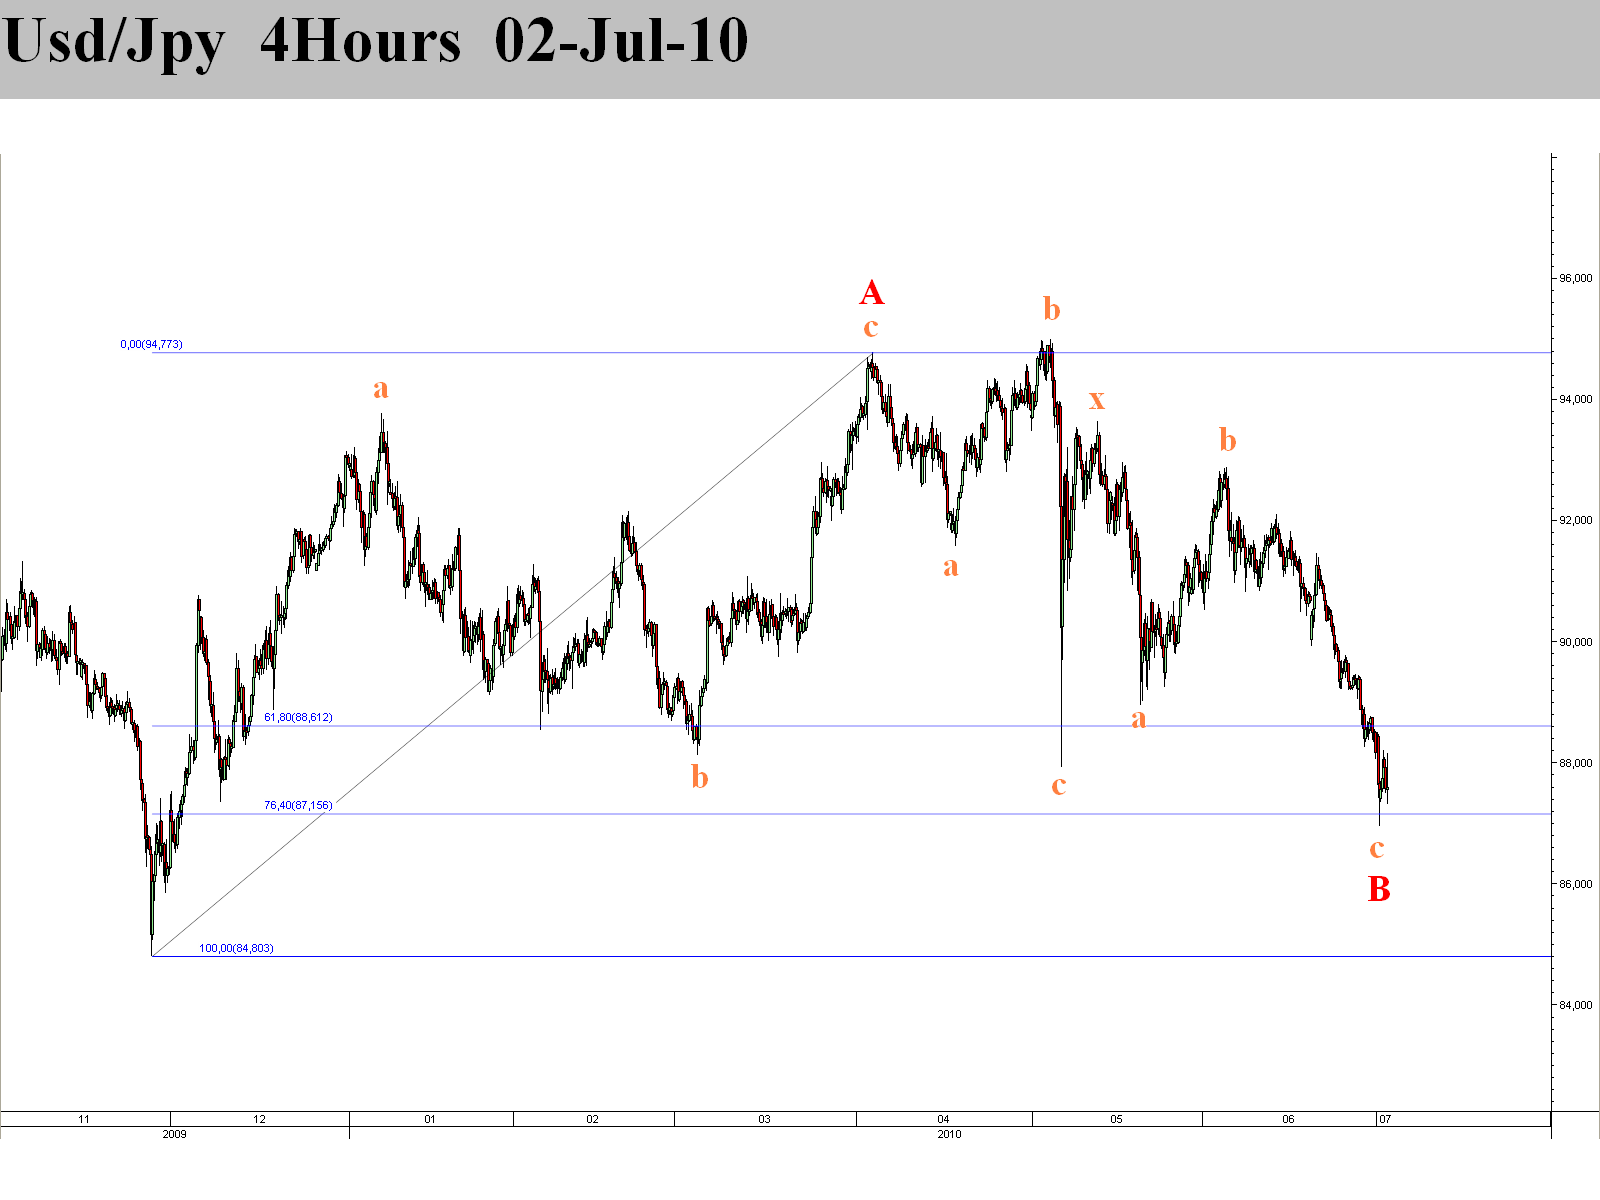
Usd/Jpy update
Usd/Jpy could have completed wave B. If completed, look for price to go higher in wave C.
Here's my count from June 1st 2010:

And here's the updated count :

Here's my count from June 1st 2010:

And here's the updated count :
Clear Direction
2 days ago i said wave C would be sharp and violent. I think recent market action fits that discription well. There's more upside to come, but the fastest action is over. I will look at the daily chart again in the next post if price goes to a new high.


Thursday, July 1, 2010
Big move ahead, but what direction?
Price is building up in what appears to be a 1-2-i, or 5 waves - 3 waves - 5 waves. Another possibility is that this is an abc pattern (zigzag is also 5-3-5). If price falls below the start of wave i as proposed in this chart, I will be more bearish and looking for a new yearly low (< 1.1875 ). If on the other hand 1.24 is broken to the upside, I will look for higher prices with confidance.


Subscribe to:
Posts (Atom)