
Friday, December 31, 2010
The last update of the year
The rally is hard to count but it looks like 1.34 will offer some resistance. There's a possibility that price has topped, but i prefer to see one more high into the 1.34 level. My focus remains on the red line posted yesterday which lays at 1.3497 to determine if we are in Y of WXY or in a triangle wave C. The triangle count looks good since it's laying on top of the 200 day SMA, a break of the triangle would mean a break of the 200 day SMA, both can be violent. I wish everyone a lot of good luck, a good health and a lot of happiness for 2011!

Thursday, December 30, 2010
Higher price, but what's next?
Price went higher as expected ( but failed to make one more low before going higher ), even broke 1.3254, which i have as a wave A high. This puts us in wave C, which could be near an end. This does not mean price can't rally anymore from here, because if we look at the 4 hour chart we can see that we are either in a C of a triangle wave B or in a wave Y of a WXY wave B.
In this count price needs to come above the red line.

In this count price needs to stay below the red line.

In this count price needs to come above the red line.

In this count price needs to stay below the red line.

Wednesday, December 29, 2010
Slowly Higher
Price went lower since yesterdays post but did so in 3 waves ( with a triangle in the middle ) in what i am now counting as a wave z. Since this low price rallied, but this is another one of those moments where it's really hard to count the wave. It looks very much like a perfect 5 waves on the 15min chart, but when you go to lower timeframes the 5 waves become very hard to count. Whatever the count, i see this recent high as a wave 1 or A with higher prices to follow after a small correction.


Tuesday, December 28, 2010
Dangerous Correction
I was looking for a corrective decline and it looks like that is what we got. But how sharp was that decline, wow ! It is really dangerous to "catch this falling knife" so be carefull should you try to go long. On the other hand it requires some faith in the EW analysis and this could be a nice opportunity.


Time for a corrective decline
We did get a small wave B in the form of a triangle. After this triangle we got 5 waves up to finish a wave C. Wave A equals wave C, which is not very common for a flat ( usually wave C = 0.618 or 1.618 of A ) but it's possible. We now have 3 waves up from the low, so i'm now expecting a corrective decline but the trend is now up.


Monday, December 27, 2010
No impulsive wave yet
The rally has broken through the trendlines but has done so in what seems like a 3 wave move. On the bigger timeframe this wave A and B visible on this chart are part of B of (B). It is possible that this price action will form a triangle B of (B). Another possibility is that instead of a wave C rally this will be a wave Y rally, which would also explain the 3 wave action.


Friday, December 24, 2010
Ready to Rally
Price has bounced of what should be a wave B low. There's a small chance that there will be another low, but for now i'm staying with the idea wave B has bottomed. The trendline has been broken, but i would really like to see the red line broken aswell. This would give confirmation that the trend has changed to up. Furthermore, i wish everyone a very mary Christmass and a happy newyear!


Thursday, December 23, 2010
It's finally here
This is the moment of truth to know if this is really a wave B or not. Price will have to reverse around these current price levels.


Wednesday, December 22, 2010
One more time
This wave B has been a very slow in development, but the target zone remains the same, 1.3040. I now think this count fits current price action best, 1 more 3 waves down ( 5 waves are also allowed, but would be a wave C ). This wave B would be a complex double three, where the second three is a complex double three on itself.


Tuesday, December 21, 2010
Possibilities and Problems
Price rallied but rallied above 1.3188. This is some reason for concern. I see a couple of possibilities to count the market now.
1/ Is the update from yesterdays main count. Here wave B is counted as an expanded wave. The decline looks impulsive from a distance, but on a 1 min chart it looks much more corrective. If the high is broken, an expanded wave B becomes very questionable.

2/ The low at 1.3094 is the wave A low. Wave B possibly not complete yet. Maybe this would explain all the corrective waves.

3/ This is yesterdays alternate count, where the big wave B is complete. Problem here is that the rally looks like 5 waves up, but internally looks much more corrective than impulsive. If you count the wave 2 correction as a failed correction you could count it as an impulsive wave.

There could be some other counts, but remember i think we are near a wave B low on a bigger scale, so be carefull when you short for if i'm correct, risk to a rally is a bit bigger than to a decline.
Monday, December 20, 2010
Getting closer to the wave B bottom
Here's yet another possibility i'm watching closely. The previous post had a WXY with Y as triangle count, but the wave W high never got exceeded, which makes it a failed corrective wave, like a failed flat, which is a rare pattern. And since i don't like to use rare patterns in my counts i'm now looking at this count (making the previous post an alternative), which has an alternative of a bottom allready. I would still prefer to see price go to the 1.3040 region first though.


Out of the range
After being stuck in a range since the opening this week price has finally broken out. I see 2 possibilities to count the sideways price action now, a WXY where the Y is a triangle or an expanded wave B, which is just an alternative.


Sunday, December 19, 2010
Bear Trap
In my last post there was some trouble with the circled area. After looking into it now, the black circled area was corrective indeed. It was however part of a bigger corrective wave. The decline from 1.3358 to 1.3133 is now counted as a ( 2nd ) wave A of a complex double three inside a bigger wave B. This wave A subdivides as a complex double three correction on itself. When price goes below 1.3133 to finish wave B, the bears will be very convinced price is going much much lower, while in fact it looks very much like that will be a bear trap.


Friday, December 17, 2010
Impulsive or corrective
I was looking for a rally and the rally came. The problem now is the decline, which has a very hard to count first part. The first part of it looks corrective, but the entire decline looks impulsive. In case it is impulsive, price will go to a new low very soon. If it is corrective, expect a new high for a wave C of b.


Thursday, December 16, 2010
Looking for a rally
Earlier i said i was looking for a bottom with a possibility of one more low. We did get one more low and the pattern looks complete now. The 3 waves down still look like a wave A. This would be wave A of B. There is a possibility that this is a complete wave B, but the rally looks corrective, so this wave B would be a wave X and we would now be in wave Y.


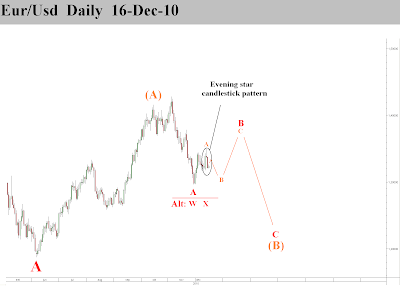
A look at the daily chart
Here's a look at where we could be in the bigger EW pattern. Since the "big report" post ( dec 4th ) A of B finished a little higher than expected. From this high price has declined in what looks more like corrective price action to me. This confirms my view that we are in a wave B. To find out where this wave B ends i will analyze smaller timeframes over the coming days. The candlestick pattern, an evening star, is a topping pattern which is here to confirm the top of wave A. This also means price will probably go a little lower before ending wave B. The alternative would put price in wave Y where the corrective wave down from the wave A ( or X ) top is the early part of Y.

Time for a pause?
We didn't get the larger pullback for wave b, but instead price plunged lower. It now looks like that decline is near an end, there might be 1 more low in it. The rally i'm looking for is again corrective and shouldn't go too high. There are a few other possibilities on the larger timeframes, but i'll post that later today or tomorrow.


Wednesday, December 15, 2010
Trend is down
Since topping around 1.35 price has declined in a corrective way. It looks as if this is only a first part of a bigger correction. The previous WXY rally should be a wave A of B, since price immediatly following the top is corrective. This puts us in wave B of B now. How long this wave will take is unknown and we'll have to wait to see how the waves roll out.


Tuesday, December 14, 2010
Pre FOMC
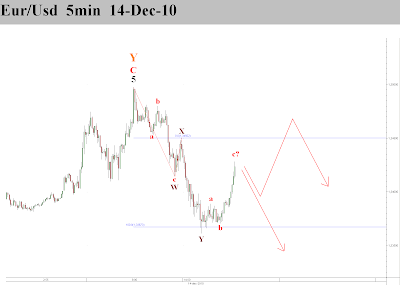
Looks like price topped around 1.3497. The 261.8% fib extention of wave a of Y and the 61.8% fib extention of wave W were enough resistance to reverse price. The reason to be cautious, is that price decline in 3 waves from the top. This means that the wave Y top was probably a major top A and a major wave B has now started. So it is normal that a big corrective wave starts with a smaller corrective wave. Don't forget the FOMC event, which could trigger big price moves.


Turning points
Price has gone too high and we have no other choice then change the count. It looks like the best way to count price from 1.2968 is a WXY correction. The reason I'm counting this as such is because wave a of Y is clearly in 3 waves. Common targets for Y waves are the 76.8% and 100% extentions of wave W. 1.3483 is the 261.8% extention of wave a of Y, which could also be a turning point. Best to be carefull if you want to try a short trade, since there still is a lot of momentum to the upside.


Monday, December 13, 2010
Just a thought
The rally just keeps going and going. It feels like a new trend has begon. Price from the lowest point of what would be counted as a finished wave B, does not look impulsive. This can mean 2 things, first that there is no wave B but a wave X and we are in wave Y higher. Second, that wave b of B is playing out like on the chart below. If price keeps moving as fast as it is, we'll know soon enough...


Unexpected rally but no big changes
Price rallied a bit more than expected, but nothing dramatic has to change on the count. I have moved up the wave B to this latest high. The triangle count got invalidated, but can be reformed by counting a bigger wave C. The bigger picture remains the same, I am still looking for wave B to finish lower. Should 1.3322 get broken, the triangle count gets invalidated, and the main count will be have to be counted as an expanded flat which is always dangerous as it could mean a new trend has started.


Saturday, December 11, 2010
2 Counts 1 Direction
While the idea remains the same from the previous post, there are some small adjustments needed. The problem is that from the latest high, there are only 3 waves down. So there is no wave C to finish the bigger corrective wave B. These 3 waves down from the latest high are probably part of a complex correction, so instead of a (ABC)X(ABC), we now get a (ABC)X(WXY). Another possibility is that all these 3 waves form a triangle wave B. So sunday at the opening i see price going a bit higher as the latest rally seems incomplete, but after that, price should decline.


Friday, December 10, 2010
Just a little lower
Price rallied in 3 waves, so the count for one more low comes into play. After this low price should rally to a new high ( above 1.3441 ).


Thursday, December 9, 2010
Bottom in or one more low
Price declined as predicted. It is possible that this decline is a finished wave C, 200MA support + wave C is almost 61.8% the size of wave A in price. In time wave C is much smaller, a little reason to be cautious, that's why i don't exclude another wave down to make this a double three correction (abcxabc). If wave B is finished now ( or after one more low ) wave C should start and take price above 1.3441.


Best to wait a little longer
Price went higher in a corrective way. There are a couple of possibilities at this time. First, B of B could be finished now and price could be ready to go lower. Second, B of B will finish higher. And lastly, there's a possibility that price will go to a new high as this rally could be a wave Y.


Wednesday, December 8, 2010
Short term update
Price has gone up in a corrective way. Here are 2 possibilities to count this correction. Don't forget that since this is a correction higher, the alternative count from the previous post comes into play.
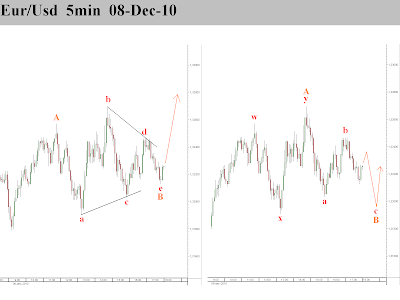

Bull Flag
We got a nice wave C down as expected. This wave C has found a lot of support now. A of B = C of B, 50% fib retracement from wave A, channel support and even round number 1.32 are all giving price support. The hourly candle formed a nice hammer through all this support, so i'm looking for price to go higher. Should this rally be in 3 waves, it would mean wave B isn't finished yet, look for 1.3080 regio to offer support then.


Tuesday, December 7, 2010
Topping wave B
Price went higher and wave B looks finished. There's a possibility for 1 more high to make a nicer looking wave y of B. 1.3441, a high made during the early sunday hours, can be broken to form an expanded flat, but any push above this level will put the count in danger of being wrong.


Monday, December 6, 2010

Wave B zigzag forming?
Looks like we did top like expected and price has been going lower since the start of the week. This decline is another wave B and looks like it might have 1 more low in it. Internally, this decline looks more impulsive ( 5 waves ) than corrective ( 3 waves ), but remember, this wave B could be a zigzag which has a structure of 5-3-5.


Saturday, December 4, 2010
The Big Report
Here's a look at different ( and larger ) timeframes, as promised in yesterdays post.

15 min :
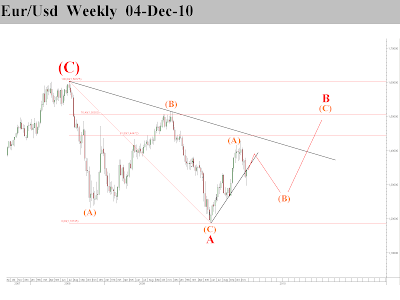
Weekly:
Price seems to be in the middle of a wave B on the weekly count.

4 Hours :
In this wave B of (B) price just finished it's first part, wave A.

15 min :
This is the updated chart from 03-Dec-10. Price made 2 more highs as expected finishing a wave C. This ABC that is finished now is part of a bigger wave A.

Friday, December 3, 2010
Important price level broken
Price didn't reverse as expected but exploded higher, suggesting the correction isn't over. Something important happened when 1.3354 was broken, the nice looking 5 waves down is now confirmed to be a wave c of a bigger correction ( the upper left choice of the chart with 6 choices was the correct one ). In other words, 1.2968 is a low that shouldn't be broken for a while. I will post a bigger timeframe chart over the weekend.


Ready to go lower?
Instead of forming an ABC, it now appears price has formed a WXY correction, which is complete or has one more spike higher in it. W and Y are close to equal and with the NFP event and the bearish looking dow, price seems ready to go lower.


Trouble in the Dow?

Thursday, December 2, 2010
Bounce or Break?
Price did pretty much as expected. But we are at a crucial time right now. Will price go to a new low? Then we will have 3 possibilities left on our 6 choice chart from nov 26th. This would fit into the alternative count of todays chart. Should price find support at the 61.8% or 76.4% fib level, then price should go to a new high.


Wednesday, December 1, 2010
Bounce or Reversal
Price has rallied after a very nice looking 5 waves down. Where these 5 waves down fit into the bigger picture is unknown, but look at the nov 26th chart for the possibilities. 1.3354 is key level, if this is broken we are in a big wave B.


Tuesday, November 30, 2010
1 of the 4 is bottoming
Here's a possibility for a bottom for EurUsd. It is the upper left choice of the 6 choice roster from the nov 26th post. 1.3354 was the high made during the first trading hours of this week (not visible on all platforms) and this would be the level of confirmation for the count proposed if broken to the upside. A new low would invalidate this count ( there is a possibility for these 5 waves down to be 1 of 5 but that would make wave c really big ) and put focus back on the remaining 3 possibilities.


Monday, November 29, 2010
4 Pack
As 2 of the possibilities have been invalidated due to price going to a new low, there are 4 possibilities left on the table. The upper left is the least bearish and the bottom right is the most bearish. Note that the chart is the same from nov 26th without updated price. Since then there was a little corrective bounce ( a little bit bigger if you consider sundays early price action ) to complete the wave b, 2 or ii.


Friday, November 26, 2010
A 6 Pack Of Choice
It appears the short term count was correct and we did get another leg down. So it's time to get back to the larger timeframes, where there are a lot of possibilities. It depends on how you count price around the top, is the top a normal wave 5 ( of C ) top or is the top followed by an unorthodox 2nd top in the form of an expanded wave b? My personal preference is for the wave b top, but i keep a close eye on the triangle count.


Thursday, November 25, 2010
Triangle
Wave 4 did transform into a more complex correction, a triangle. 1.3420 is the limit for the triangle count. Should price go above that level, wave 4 will be counted as a double three complex correction.


Wednesday, November 24, 2010
One more wave down
With all the possibilities on the bigger timeframes, it's time to zoom in a bit. Here, things seem a bit more clear. 15min chart shows a nice impulsive wave down where we need one more wave, wave 5. Wave 4 could be finished or could transform into a more complex corrective wave.


Tuesday, November 23, 2010
3 Possibilities
Unless this decline was an expanded wave b of B flat ( first alt count ) this count now looks like the most possible count. Another alternative brings back the triangle wave 4 count, where the top is not an expanded wave but a regular top. This alternative count would put price in a wave C with lower prices to come ( price 1.3785 - 1.3660 is in 1-2-i ). In the other 2 counts price needs to rebound higher ( price 1.3785 - 1.3660 would be counted as a-b-c ).


Subscribe to:
Comments (Atom)