Sunday, July 10, 2011
Triangles in question
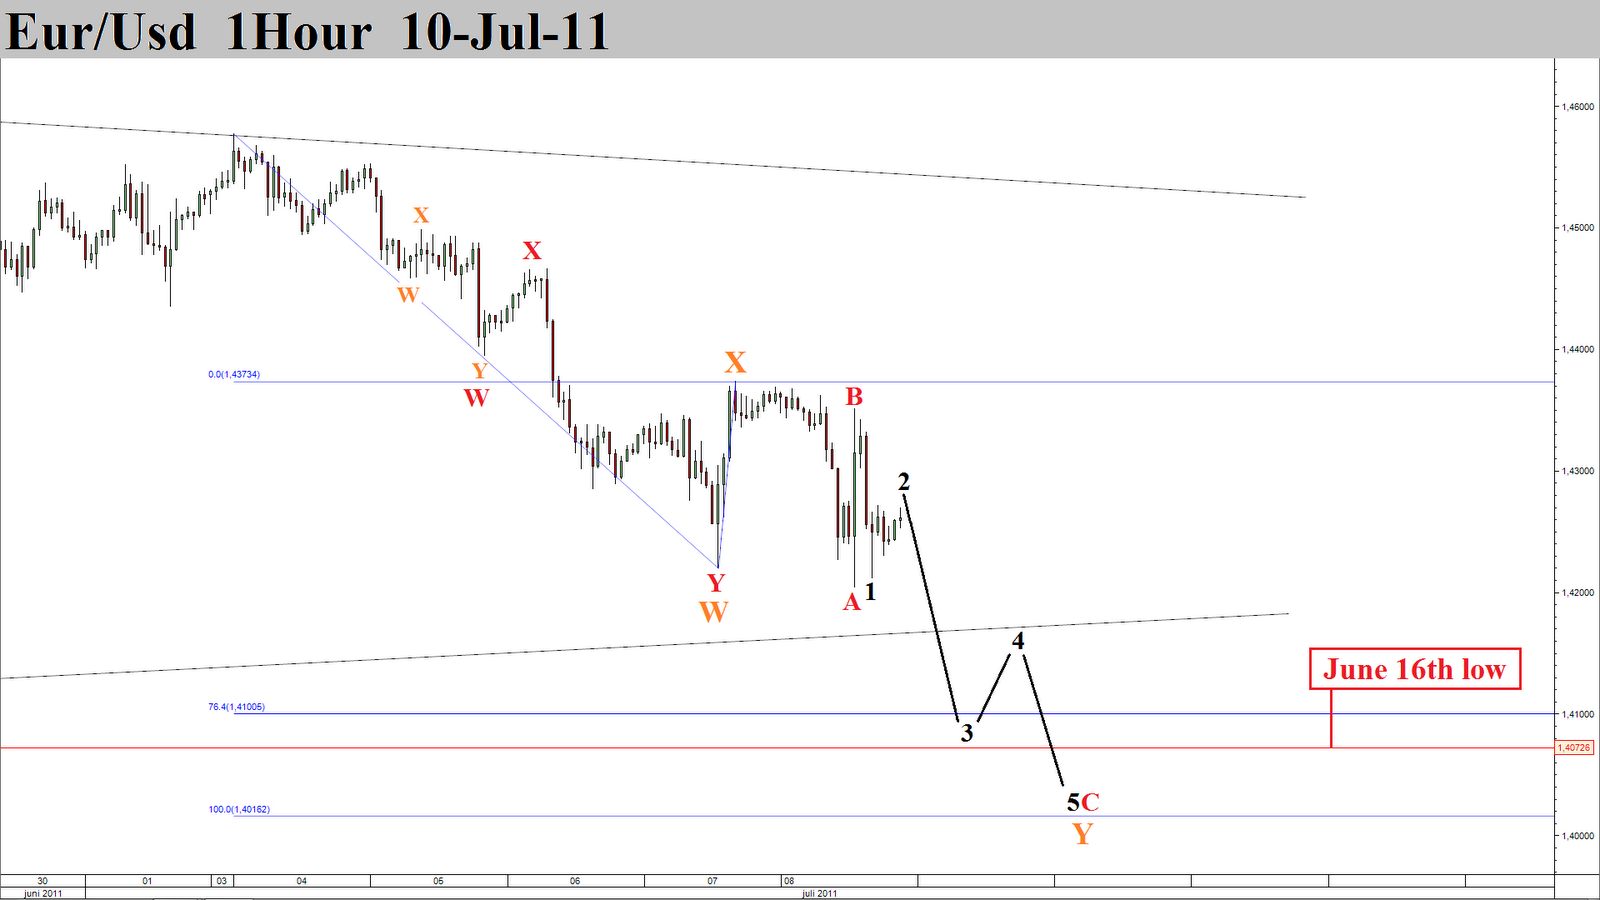
It seems price wants to go lower. If this count is correct wave C of Y should enter a 3th wave early in the next trading week. An alternative is that this impulsive wave 1 of C is actually the first wave of a zigzag (5-3-5). That would imply that there is no wave C but a wave Y of Y, which could even be only a first part of Y. Sounds confusing? Don't worry, corrective wave action always is.

Subscribe to:
Post Comments (Atom)
Hi Jeremy!
ReplyDeleteYour perspective is interesting, especially after that daily hammer from Thursday which then got negated on Friday.
I was tempted to see the last wave down from 1.4578 as a wxyxz where the z wave is the one from 1.4373 down to 1.4205. This version was also somehow supported by the divergence between price and RSI on the 1h and 4h charts.
Now I am puzzled by the wave 1 in your scenario which, I have to accept that, on the 1 min chart looks impulsive.
It seems that your count is more inspired.
Thanks and best regards,
Catalin