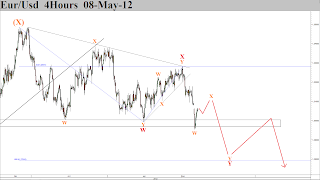
In the last post i was looking for price to break out to the downside and it did. The decline has stalled at the 1.3000 support level but should continue lower to finish a complete 3 wave pattern from the 1.3485 high. After this, price will probably retest the 1.3000 former support turned into resistance zone before resuming the downtrend which will eventually break the 2010 low at 1.1875.
Tuesday, May 8, 2012
Subscribe to:
Post Comments (Atom)

hello ..
ReplyDeletedown trend continue to the triangle target around 1.2600
we are waiting .. ☺
http://s17.postimage.org/9ej9bs2sd/image.png
hope you all profitable trades ..
Hi,
ReplyDeleteIt looks like you were correct about 1.26, congrats! Personally i wouldn't count it as an EW triangle because there are rules broken ( wave D goes beyond the end of wave B ), but with those trendlines you show it can certainly be a traditional triangle.
Following my count from my last update, and having a quick glance at the charts, i believe the rally to test 1.30 could have started allready or will soon.
Best of luck!
Greetings,
Jeremy
Hello dear friend ..
ReplyDeletecongratulations for all , actually my view was a classic view not based on counting waves as i don't use Elliott in my trading ..
anyway , i still expect more and more down movement especially after the weekly close below the last low ..
we will keep watching ☺
deep thanks ,,
thanks for this useful post.
ReplyDeletelive trading room
forex coach