
Friday, July 29, 2011
Eur/Usd : Still bearish
Price is still below the trendline, but testing it now. A big break and close above the trendline brings the new downtrend in danger. Instead of getting a 3th wave down, price decided to make a zigzag wave Y. The sharp rally could be a wave B ( or X ).

Eur/Usd : Bears in control
The trendline got broken yesterday and has now been retested. It seems price is ready to continue it's decline.


Thursday, July 28, 2011
EurUsd : Right Shoulder
It's moment of truth for the rising trendline which has held for longer than 1 month and has bounced 2 times. There is a possibility for some ranged price action which would form a right shoulder in a head and shoulder pattern. The most important thing is the trendline here. If it breaks price will go lower fast. As to how low price will go we have to remember the alternatives. A bigger wave X ( above 1.4535 but below 1.4939 ) or a wave Z on the daily count ( above 1.4939 ).


Tuesday, July 26, 2011
Eur/Usd How high will the corrective wave go
There are different ways to count the rally from the bottom but i believe it is corrective. Price is now at the 61.8% fib retracement from the top, which could offer resistance, then again the trendline got broken to the upside, so that could be bullish. Price could go higher even to a new high ( in the form of a wave Z on the daily count ), so i prefer to stand aside and let the market clear things out. A break of the rising trendline would awaken my interest in a short position again.


Monday, July 25, 2011
Longterm Eur/Gbp
It looks like eur/gbp will go a little higher with heavy fib resistance around 0.9200. This does not mean that eur/usd will go higher too. It could simply mean that gbp/usd will drop faster than eur/usd.


Sunday, July 24, 2011
Longterm Eur/Jpy
Here's a longterm count for Eur/Jpy. There are a lot of alternative counts, both bullish and bearish.


Longterm Gbp/Jpy
Here's a count for the weekly chart for "Geppy". The alternative triangle wave (X) can still transform into a bigger triangle.


Thursday, July 21, 2011
Real end of wave X?
There was another leg on this corrective wave. Im not certain if this last wave up is impulsive (5) or corrective (3), but i'm expecting resistance at the 100% fib extention. There are alternatives like this high being a top of the first part of a bigger corrective wave X. It could even go to above 1.4939 in the form of a wave Z. We'll have to wait to see how the market reacts to the news out of europe.


Corrective wave x finished
Price has followed the projected path and has now turned down again. This latest top was a wave x or b high and we now start a wave y or c down.


Monday, July 18, 2011
Major Top for Gold
Gold in us dollars ( xau/usd ) has been following the prediction pretty well ( click on Gold under labels ) and it now seems the moment of truth is here. I've had the 1600 target for just a little less than 1 year and price is there now. With the US Debt problems in the picture, this may be the spark that lights the fire of the gold bear. The sentiment is at extremes as it has been for a while indicating a top is near. It seems everyone is bullish gold and expects inflation will run out of control.


Thursday, July 14, 2011
Countertrend rally
The first part of the rally is over. It is possible that this is only a first part of the rally but it's also possible that the countertrend rally is complete. The same goes for this smaller wave X on the chart below. It could be finished or have another leg lower in it.


Tuesday, July 12, 2011
Trendline confirmation
To clear things up a little, here is the count for the daily chart. As you can see the trendline still needs to break to confirm. Todays candlestick seems like it will end as a doji or hammer, this is bullish. The rally price is in now should be wave X of (W), but as an alternative this could still be wave (Z) of X. In the main count, the size of wave X of (W) can vary, but i'm thinking a small wave could be in play because the downtrend should accelerate. Then again, wave X of (W) could also be B of (W) in an expanded flat. Once again, time will tell.


Bullish ?!
With everyone now convinced that the bear is awake, it seems like now is the time for a rally. I know that the fundamentals are against this view, with the euro debt crisis getting a lot of attention, but this count is what i see not what i believe. This doesn't mean i'm looking for a new high, since the 1.4939 high is probably a wave X, the decline will be corrective.


Sunday, July 10, 2011
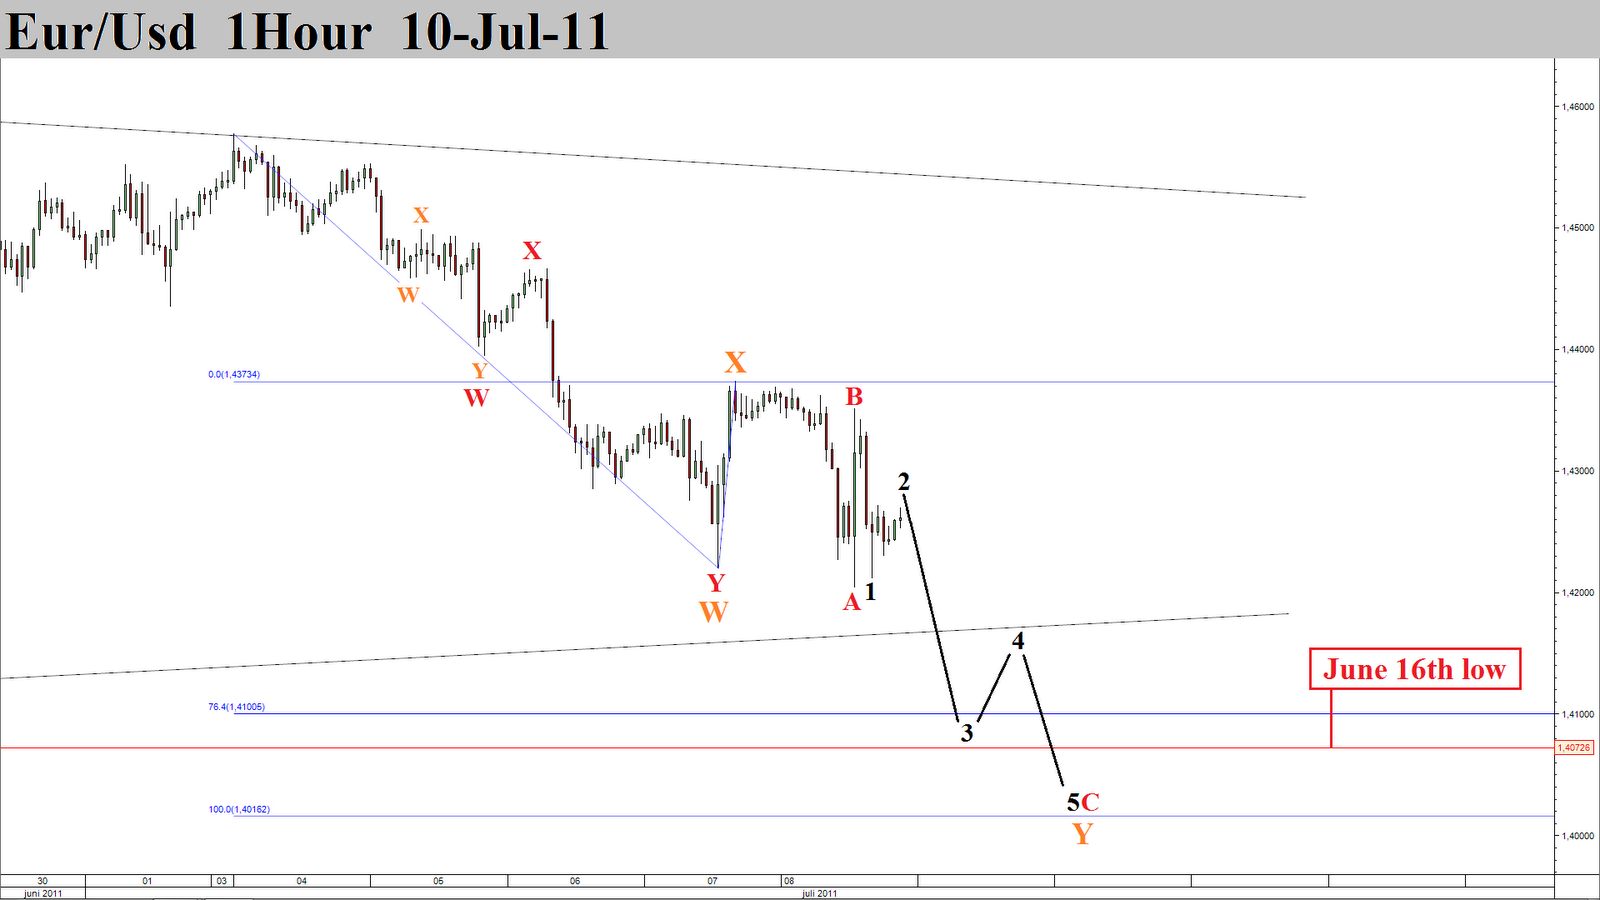
Triangles in question
It seems price wants to go lower. If this count is correct wave C of Y should enter a 3th wave early in the next trading week. An alternative is that this impulsive wave 1 of C is actually the first wave of a zigzag (5-3-5). That would imply that there is no wave C but a wave Y of Y, which could even be only a first part of Y. Sounds confusing? Don't worry, corrective wave action always is.

Wednesday, July 6, 2011
Corrective decline
The decline is clearly corrective. This means that the top is either wave D of a bullish triangle, making this decline wave E. The top could also be wave C of a bearish triangle, putting price in a wave D decline. Another possibility is that the top was wave X of Y.


Friday, July 1, 2011
Waiting for direction
Price again went higher then i expected. We now have a couple of possibilities, with the obvious triangle counts, both bullish and bearish. And my previous main count, where Y of Y should start now. I give equal chances to each scenario, so i prefer to wait until price clears up. One last thing, remember the price action from oct '08 and nov '08. Everyone was looking for a triangle, but instead of getting a small wave E, there was a 2000 pip rally.


Subscribe to:
Posts (Atom)